Fig. 6.
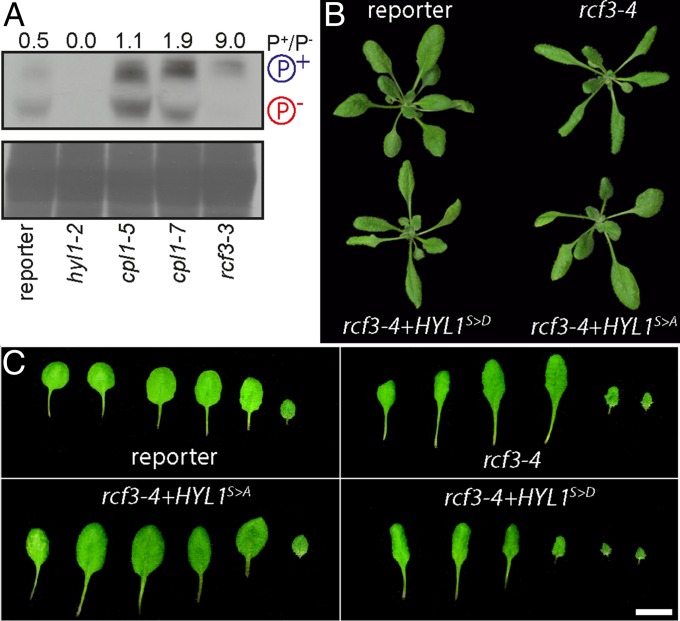
Effect of RCF3 on HYL1 phosphorylation. (A) Phosphoprotein mobility shift assay, using PhosTag and anti-HYL1 antibodies. Hypo- and hyperphosphorylated HYL1 forms are indicated as P− and P+, respectively. Coomassie staining below as loading control. The intensity of the bands was measured with ImageJ and is expressed as the ratio of the hyper-/hypophosphorylated forms. (B and C) 14-days-old plants and leaf series, showing phenotypic rescue after transformation with HYL1 hyper- (S > D) and hypo- (S > A) phosphomimics. In B, plants were imaged individually and mounted in a single black background square to facilitate the comparison and observation.

