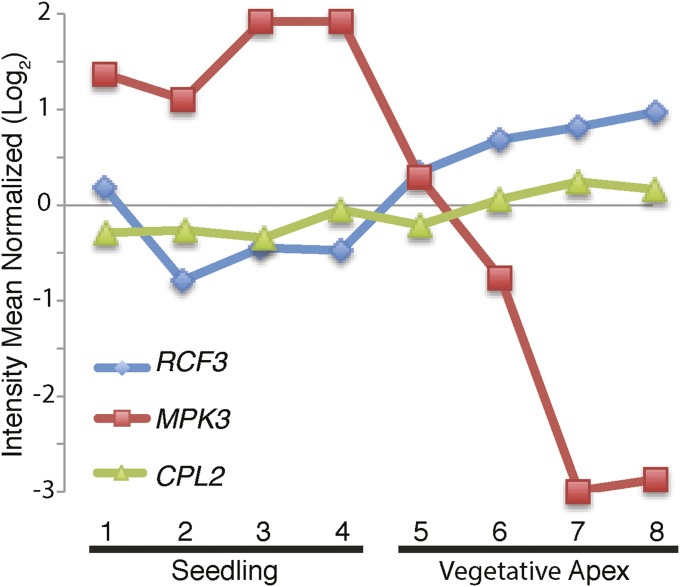
Fig. S8.
RCF3, CPL2, and MPK3 expression profiles. mRNA abundance, quantified by Affymetrix microarrays, was extracted from the AtGenExpress database (25) and expressed as the mean of the normalized reads. Points 1 and 2, 8-d-old seedling; 3 and 4, 21-d-old seedling; 5, 7-d-old apex + young leaves; 6, 7-d-old apices; 7, 14-d-old apices before bolting; 8, 21-d-old apices after bolting.

