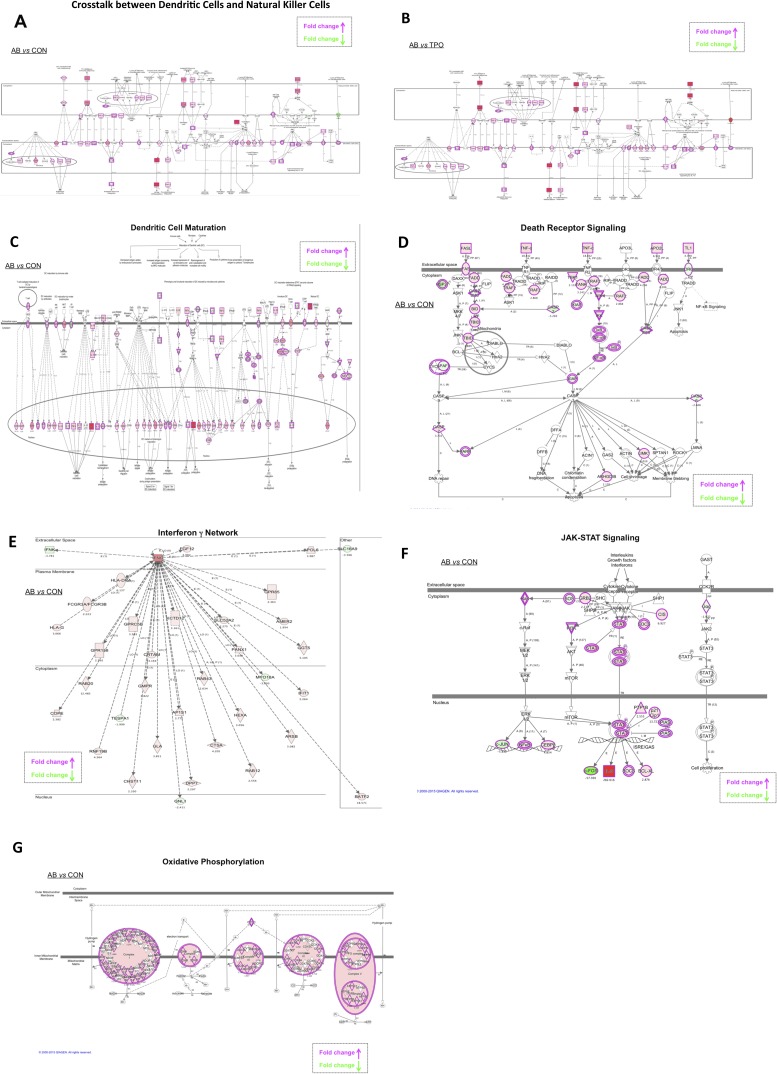
Fig. S6.
IPA of the whole transcriptome. (A and B) Analysis of crosstalk between dendritic cells and natural killer cells. Transcriptomes of antibody-treated vs. untreated (A) or antibody-treated vs. TPO-treated samples (B) were analyzed. Up-regulated interactions are shown in red, and suppressed interactions are shown in green. Color intensity is relative to expression level. Genes along canonical pathways that were not changed at transcript level are not colored. The arrows point in the direction of positive regulation. (C–G) Analyses of dendritic cell maturation (C), death receptor signaling (D), IFN-γ network (E), JAK-STAT signaling (F), and oxidative phosphorylation (G).

