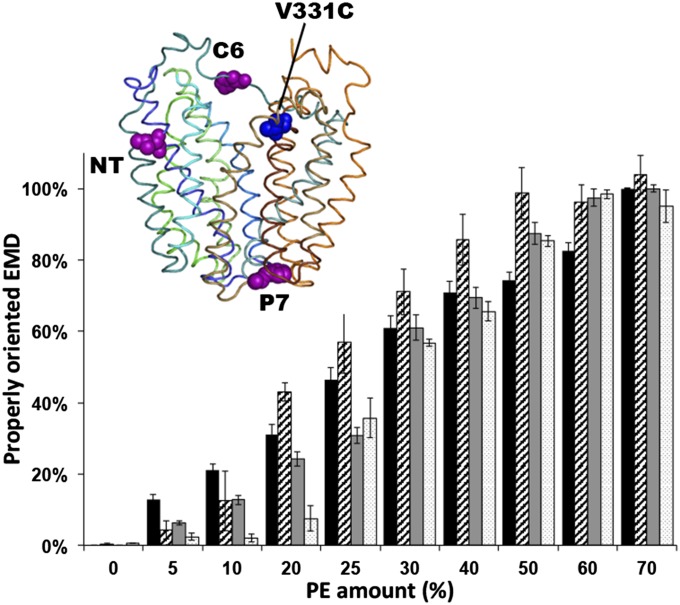
Fig. 2.
Detection of topological rearrangements in LacY by Trp-IAEDANS FRET. The bar graph shows the percentage of normalized FRET (black and gray) or percentage of properly oriented LacY as determined by the Cys accessibility method (SCAM; diagonal and white) [data from Vitrac et al. (7)] as a function of PE content in proteoliposomes for Trp replacement in C6 (black) and NT (gray) and single Cys replacements in C6 (diagonal) and NT (white). The graph represents the average of three different experiments, with error bars indicating SD. Normalization of FRET was performed using proteoliposomes containing no PE or 70% PE as a minimal or maximal FRET value, respectively. Data represent the normalized FRET expressed as the ratio (F − F0%)/(F70% − F0%), as described in SI Methods. (Inset) Side view of LacY (Protein Data Bank ID code 2CFQ). TMD helices are rainbow-colored from green (TMD I) to orange (TMD XII). Diagnostic Trp replacements introduced individually in EMDs NT, C6, and P7 are shown with the indicated positions of Cα atoms of Trp (magenta spheres). The IAEDANS label is at Cys331 (blue sphere).

