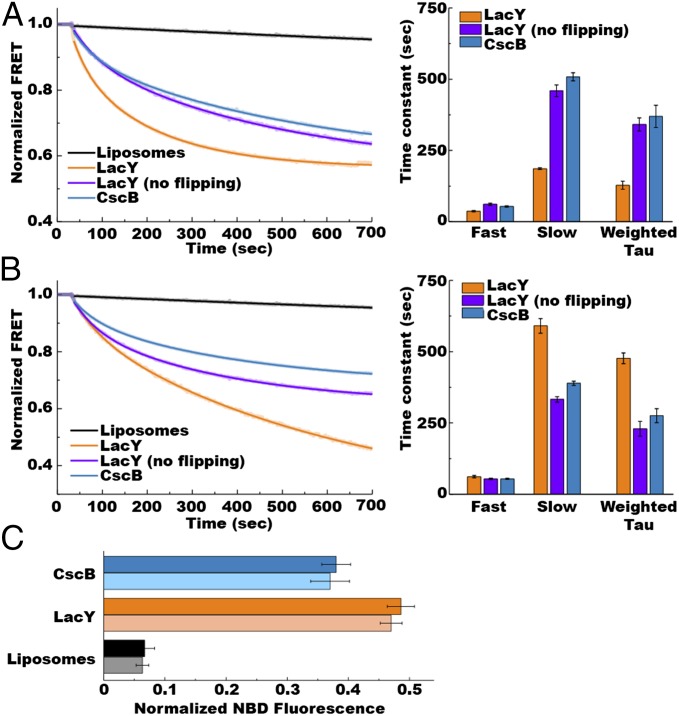
Fig. 4.
Lipid flipping across the lipid bilayers upon changes in phospholipid composition. Real-time NBD-PE quenching by dithionite measurements of protein-free liposomes (black traces) or proteoliposomes containing either LacY (orange and purple traces) or CscB (blue traces) and submitted to lipid exchange to trigger addition (A) or dilution (B) of PE is displayed. (A) Addition of PE was performed with MLVs made of total lipid extracts from PE-containing E. coli (75% PE/15% PG/5% CL) and proteoliposomes or from liposomes made of total lipid extracts from PE-lacking E. coli (50% PG/45% CL). (B) Lipid compositions for MLVs and proteoliposomes or liposomes were reversed to perform dilution of PE. Lipid exchange was triggered by addition of liposomes or proteoliposomes to MβCD-loaded MLVs 30 s after stabilization of fluorescence, with quenching kinetics measured at 1-s intervals. (C) Histogram shows percentage of normalized NBD fluorescence measured after 30 min of lipid exchange in liposomes and proteoliposomes containing LacY or CscB when performing resupply (dark-colored bars) or dilution (light-colored bars) of PE. Data represent the mean ± SD of six independent experiments. Data represent the normalized NBD-PE fluorescence expressed as the ratio (F(t) − F0)/(Fmax − F0), as described in SI Methods. The experiments were repeated three to five times, and the data represent mean values ± lower and upper confidence limits from exponential fits of the data. The bar graph displays time constants from Table S1.

