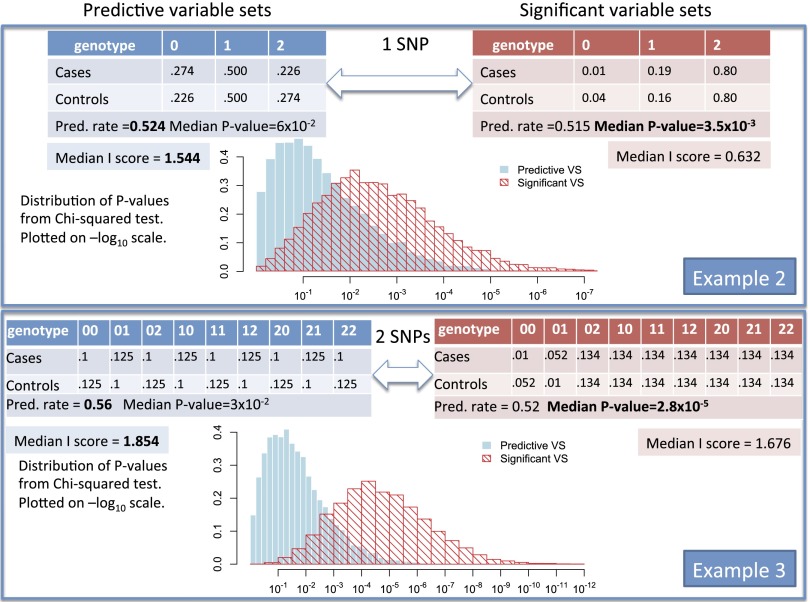
Fig. 2.
Reversals of predictive and significant variable sets in SNP examples. Example 2 has one explanatory variable (1 SNP) for which the probabilities under cases and controls are listed in the tables. Example 3 has two explanatory variables (2 SNPs) for which the probabilities under cases and controls are listed in the tables. Left-hand-side tables (in blue) are for more predictive variable sets, whereas right-hand-side tables (in red) are for more significant variable sets. The prediction rate (proportion of correct predictions) of each variable set (of size 1 or 2) can be directly computed using the genotype frequencies specified. Using sample sizes of 500 cases and 500 controls, we simulate random case-control data sets by simulating genotype counts among cases and controls using the genotype frequencies specified. I score and the χ2 test statistic were computed for each simulated data set. Simulation details can be found in the Supporting Information.

