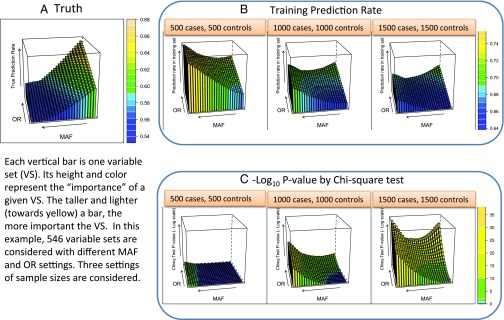
Fig. 3.
Disconnect between true prediction power of a variable set and its empirical training set prediction rate and test-based significance. We use 546 variable sets of 6 SNPs with varying levels of disease information (both MAFs and ORs). This results in a partition of 729 cells, each corresponding to a genotype combination on the 6 SNPs represented by this variable set. Three levels of sample size are considered, 500 cases and 500 controls, 1,000 cases and 1,000 controls, and 1,500 cases and 1,500 controls. For each variable set, the theoretical Bayes rate is computed based on the population frequencies and odds ratios. Two thousand independent simulations under each variable sets—given a sample size specification—were used to evaluate the average training prediction error, P value from the χ2 test, and the I-score prediction rate. A depicts the true prediction rate for each of the 546 variable sets for the varying OR and MAF levels. B shows the corresponding training prediction rate as the sample size increases from 500 cases and 500 controls up to 1,500 cases and 1,500 controls. C depicts the corresponding χ2 test P value for each of the variable sets across the three sample sizes. Simulation details can be found in the Supporting Information.

