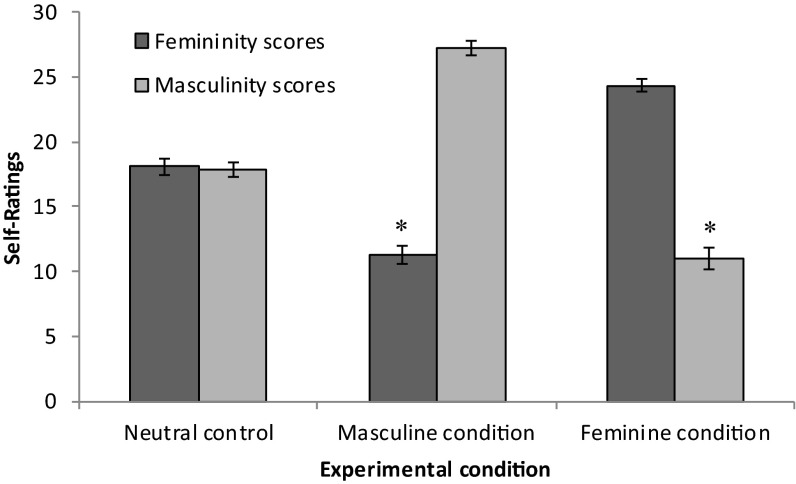
Fig. 2.
Mean gender self-ratings on femininity and masculinity subscales (41, 42) by condition (neutral control, masculine, and feminine), with SE bars. Means are inclusive of men and women given no significant differences between them. Asterisks indicate that femininity and masculinity scores differ significantly in both experimental conditions at P < 0.05. N = 54.

