Fig. 1.
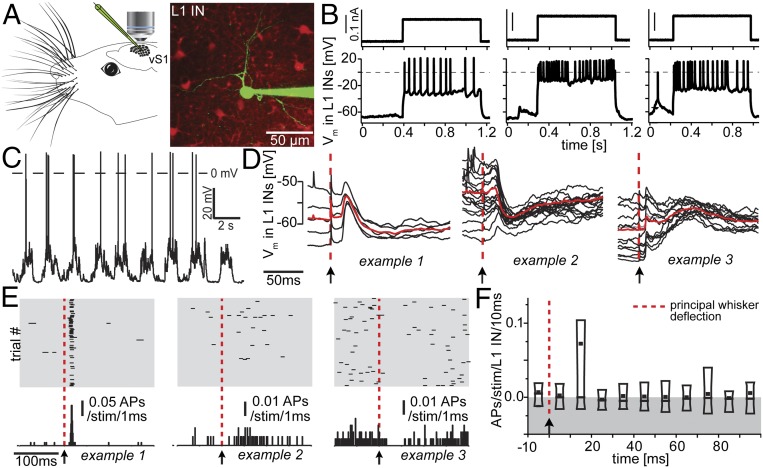
Functional characterization of L1 INs recorded in vivo. (A) Individual L1 INs in rat vS1 were targeted for whole-cell recordings using 2p microscopy. (B) Step current injection-evoked spiking responses (three exemplary neurons are shown). (C) Ongoing up- and down-state activity of exemplary L1 IN. (D) All recorded L1 INs had short latency subthreshold responses following whisker deflections (three exemplary neurons are shown). Red, average across trials. (E) Whisker-evoked spiking of the neurons shown in D. (F) Poststimulus time histogram at 10-ms resolution of whisker-evoked spiking across all recorded L1 INs. Box, 10th–90th percentile; line, median; dot, mean.

