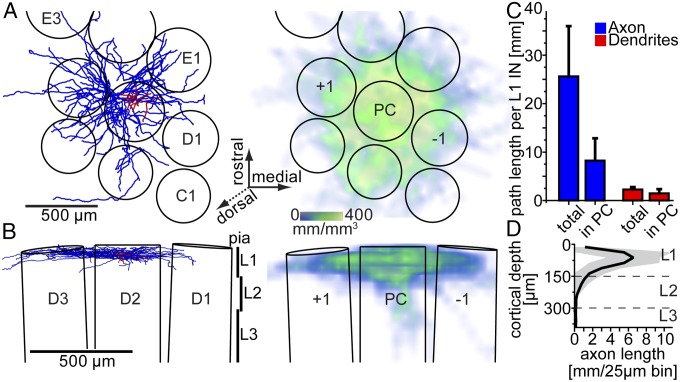
Fig. 2.
Morphological characterization of L1 INs labeled in vivo. (A) (Left) Exemplary reconstruction of L1 IN (red, dendrites; blue, axon) registered to a 3D model of vS1 (top view onto the cortical surface). (Right) 3D axon density averaged across all reconstructed and registered L1 INs. (B) Coronal views of A. Axonal projections remained either confined to L1 (Left) or displayed additional sparse branches descending into L2 (Right). (C) Average path lengths per L1 IN within and outside the principal column (PC). (D) 1D axon length profile along the vertical cortex axis averaged across all L1 INs (black, mean; gray, SD).

