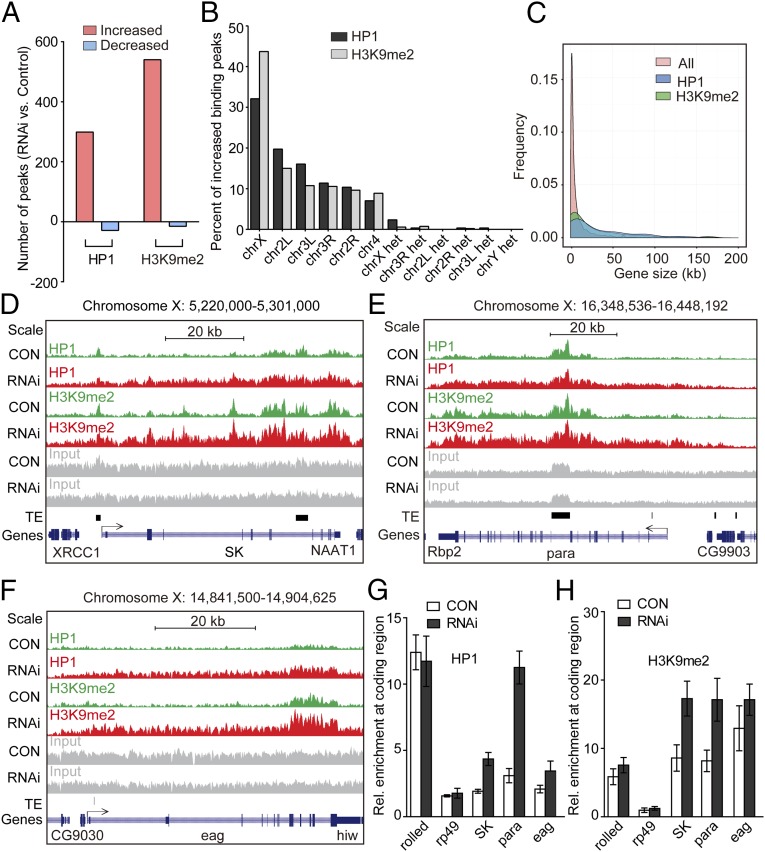
Fig. 3.
ChIP-seq analysis of heterochromatin enrichment after CDK12 knockdown. (A) The binding of HP1 and H3K9me2 is increased genome-wide after CDK12 depletion. The numbers of increased (red) and decreased (blue) binding peaks of H3K9me2 or HP1 are indicated. (B) HP1 and H3K9me2 preferentially associate with the X chromosome. The percentages of increased binding peaks of HP1 (black) or H3K9me2 (gray) on different chromosomes and heterochromatic domains are indicated. (C) HP1 and H3K9me2 preferentially associate with long genes. The comparisons of all Drosophila genes and genes with increased HP1 and H3K9me2 bindings with regard to the gene size are shown. The data for the gene length were obtained from the University of California at Santa Cruz Genome Browser. (D–F) The distribution of HP1 and H3K9me2 at three long genes on the X chromosome, (D) SK, (E) para, and (F) eag, in control (green) and CDK12 depletion (red) larvae. ChIP-seq input (gray), transposable elements (TEs; black), and the reference genes (blue) are illustrated. All annotated TE insertions on the X chromosome were obtained from FlyBase. The direction of gene transcription is indicated by arrows. The height range for all peak panels in D and F is 10–215, and the height range for all peak panels in E is 10–410. (G and H) ChIP assay and quantitative PCR analysis validate the increased binding of HP1 and H3K9me2 at gene bodies on the X chromosome after CDK12 depletion. The bars show enrichment of HP1 or H3K9me2 normalized to input and the internal control gene GS, which shows no binding of HP1 and H3K9me2 in the ChIP-seq analysis; rolled serves as a positive control, whereas rp49 serves as a negative control. The primers were designed based on sequences within the transcribed regions of these genes. Error bars indicate SD (n = 3). CON, control.

