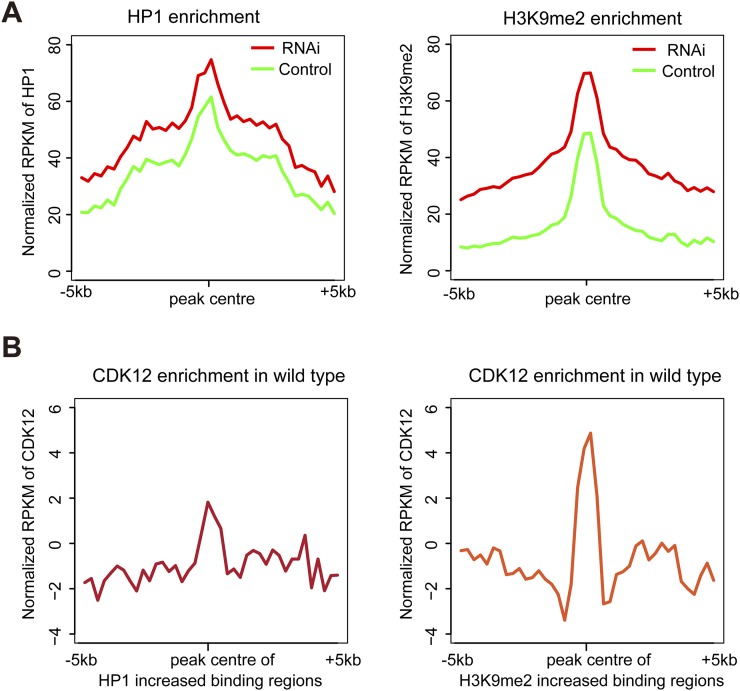
Fig. S4.
The average enrichment levels of HP1, H3K9me2, and CDK12 in the peak regions with increased heterochromatin accumulation after CDK12 depletion. (A) The average enrichment levels of HP1 and H3K9me2 around the peak regions in the whole genome were calculated in both control and CDK12 knockdown. The peak regions are where the binding levels of HP1 or H3K9me2 have increased after CDK12 depletion. (B) The average enrichment of CDK12 was calculated in the regions of the genome where the binding peaks of HP1 or H3K9me2 were increased after CDK12 depletion.

