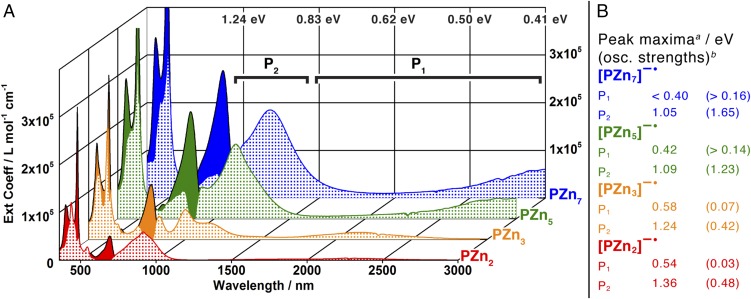
Fig. 3.
Electronic spectral signatures of the PZnn electron polarons. (A) Absorption spectra of PZnn neutral (solid fill) and anion radical states (checked fill) in THF solvent; polaron bands P1 and P2 are labeled. (B) Electron polaron P2 and P1 transition manifold maxima and associated integrated oscillator strengths. aPeak maxima do not reflect [0,0] transition energies due to the vibronic and electronic complexity of the polaron spectra. aDetails of oscillator strength determination of various electronic transitions are reported in SI Appendix.

