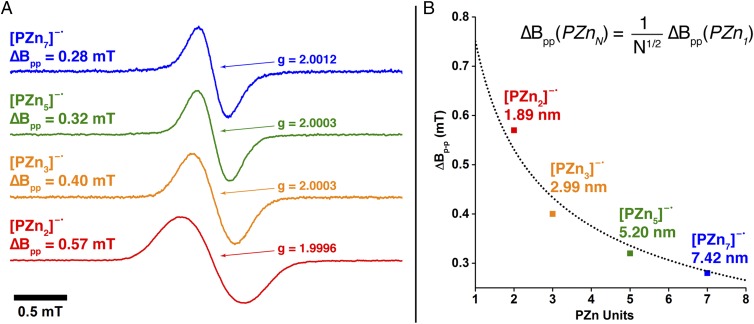
Fig. 5.
ESR spectral signatures of PZnn electron polarons. (A) X-band ESR spectra of PZnn electron polarons recorded at 298 K in THF solvent. (B) (squares) Peak-to-peak line widths ∆Bpp from ESR spectroscopic measurements on [PZnn]−• plotted as a function of PZn repeat units, and (dotted line) fit of ∆Bpp to ∆Bpp(N-mer) = (1/N1/2)∆Bpp(monomer).

