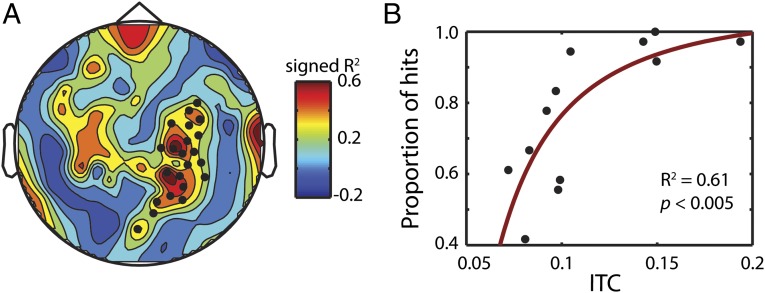
Fig. 4.
Entrainment correlates with pitch-shift detection. (A) Topography of the correlation between entrainment at the dominant rate and proportion of hits (see Materials and Methods for details of the correlation analysis). Black dots mark significant channels tested using a cluster permutation test (P < 0.05). (B) Scatter plot of ITC and hit percentage for the significant channels marked in A.

