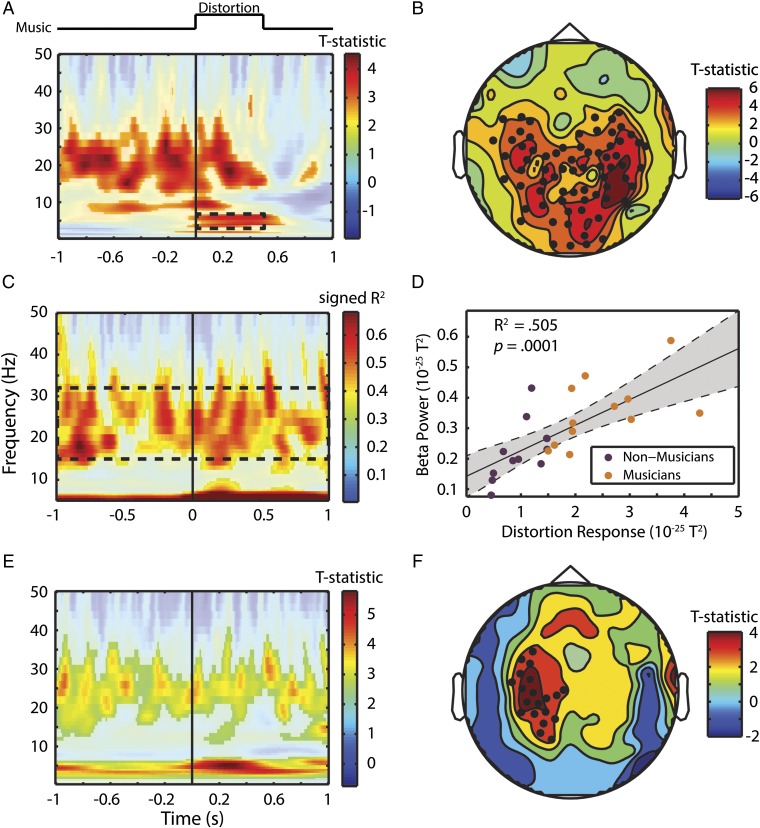
Fig. 6.
Sensorimotor beta power facilitates musical content processing. (A) Contrast of hits and misses in auditory channel power analysis. The solid line marks the onset of the pitch distortion. Dashed box marks distortion response that was used for correlations in C and D. (B) Topography of the accuracy contrast (shown in A) in beta power from 1 s before to 1 s after target onset. Black dots mark significant channels based on cluster permutation test. (C) Correlation of power at each time point and frequency with the distortion response marked as dashed square in A. D shows a scatter plot of the beta power (dashed box in C) by the distortion response (dashed box in A) for each subject. Purple and orange dots are NM and M, respectively. (E) Comparison of M vs. NM around the target stimulus. Missed target trials were thrown out, and trial numbers were matched in each group for this analysis. (F) Topography of the effect of musical expertise. Black dots mark significant channels tested via cluster permutation test.

