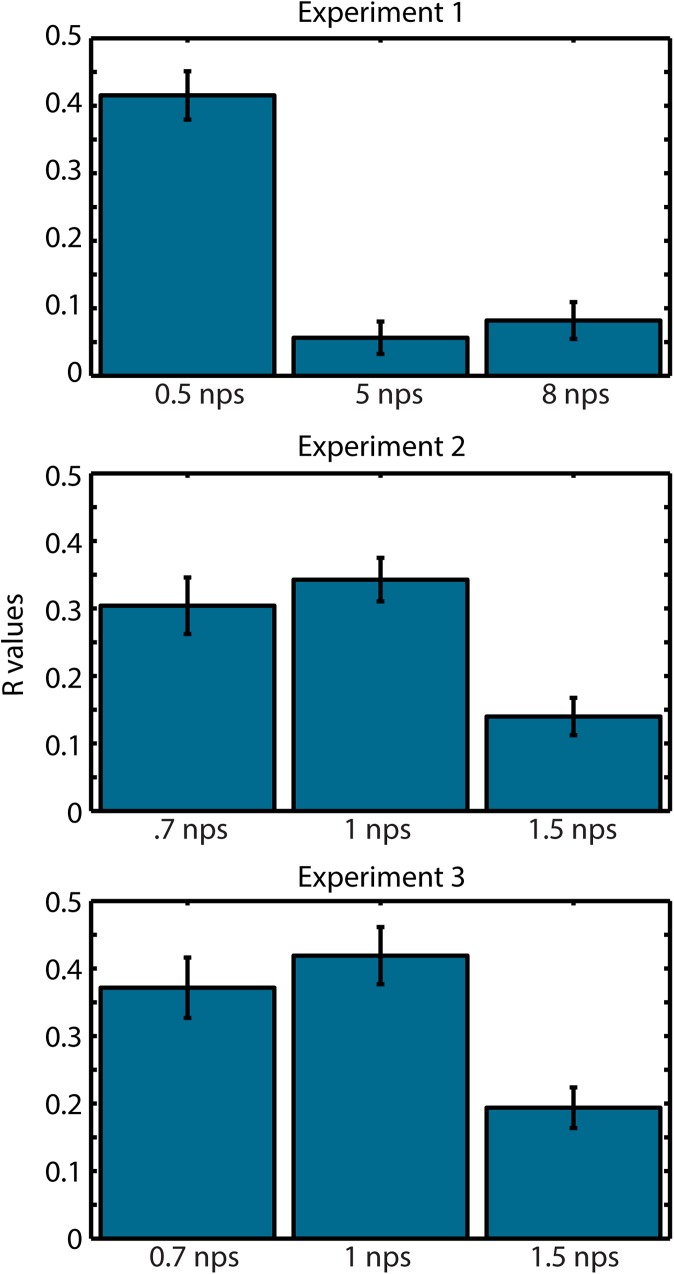
Fig. S2.
ITC driven by onset responses for note rates at and below 1 nps. We averaged ITC from 0.5 to 10 Hz and correlated the time-series with the stimulus envelope. We do this for each subject, Fisher-transform the R values, and average them. We observe a strong temporal correlation with all note rates at 1 nps and below, reflecting onset responses. Above that rate, the correlation is drastically reduced as the auditory cortex moves to a cortical entrainment mechanism. This analysis reinforces the notion that 1 Hz represents a transition point from stream entrainment to sequential onset responses.

