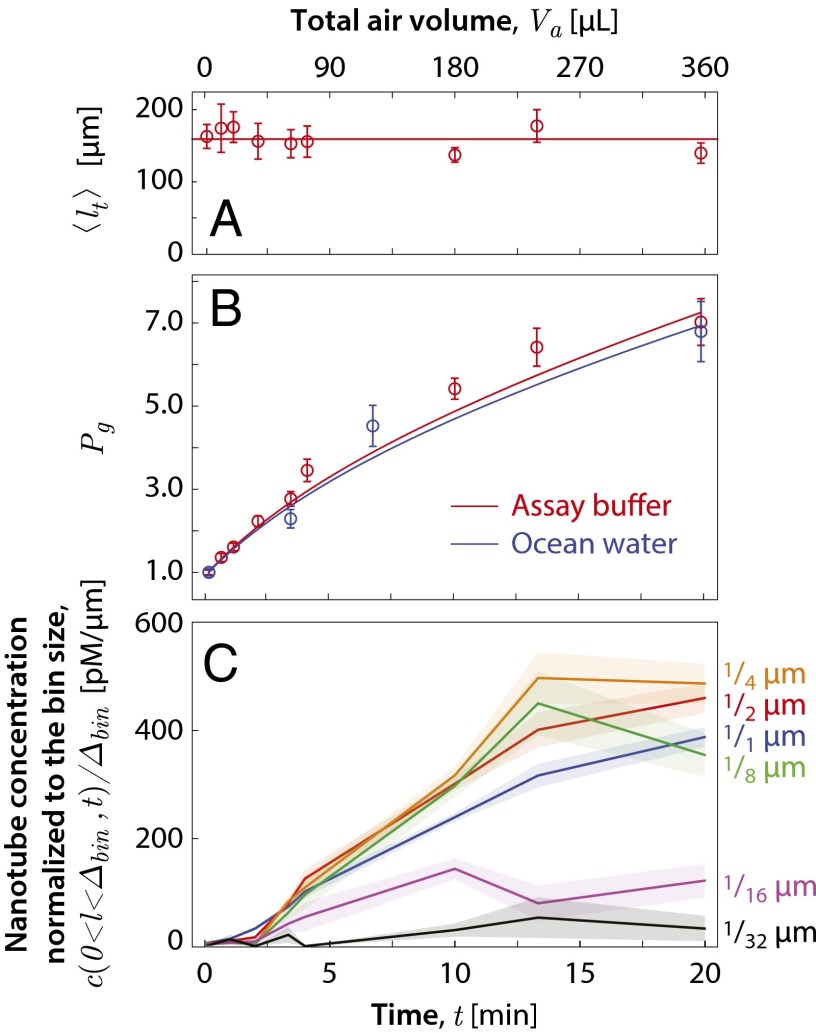
Fig. 4.
DNA-nanotube fragmentation data as a function of the bubbling exposure time at a flow rate of 18 mL/min. (A) Total tube length per microscope field of view. The horizontal line represents a constant total tube length of 159 μm per image. Error bars show the SEM. (B) Plot of the population ratio for experiments in assay buffer (red) and in ocean water (blue). The lines are the Bayesian fit to the experiments in assay buffer (red) and in ocean water (blue) based on the theory described in the model section. (C) Plot of the nanotube concentration per tube length in the length range for , , , , , and μm. (See SI Appendix, Fig. S2 for detailed histograms.)

