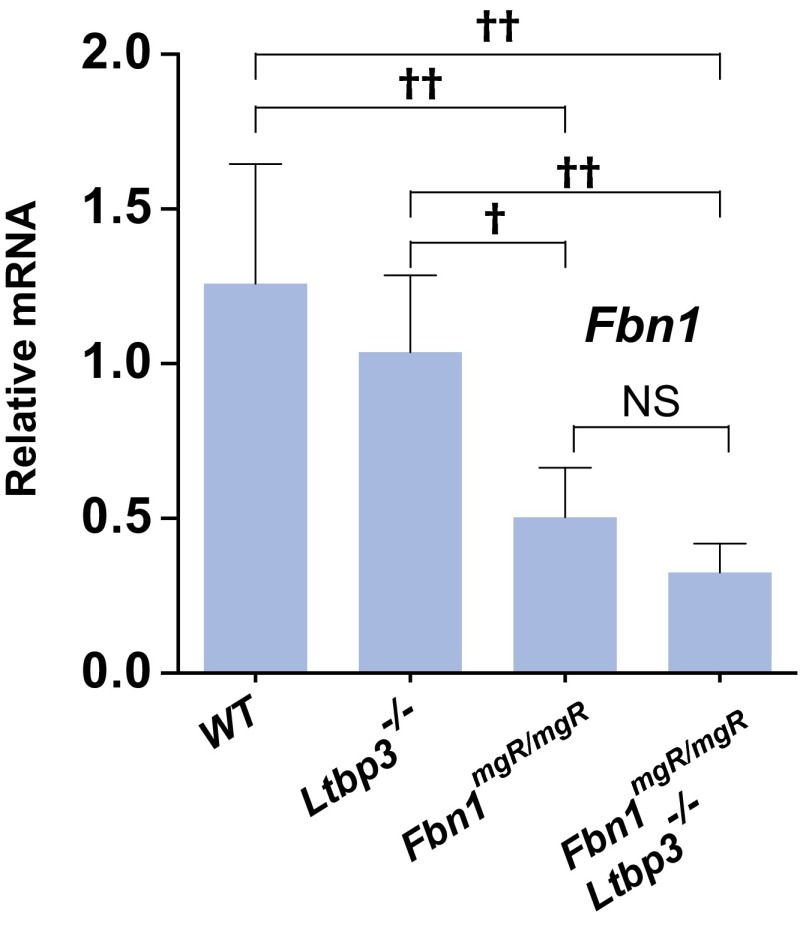
Fig. S3.
Quantitative PCR analysis from Wt, Ltbp3−/−, Fbn1mgR/mgR, and Fbn1mgR/mgR:Ltbp3−/− ascending aortas. Total cellular RNA was isolated from 2-mo-old aortas, and the expression of Fbn1 was analyzed. mRNA expression levels were normalized to Gapdh. Data are presented as the mean ± SD of five to seven samples for each genotype. †P < 0.01; ††P < 0.001. ANOVA, P < 0.001. NS, not significant.

