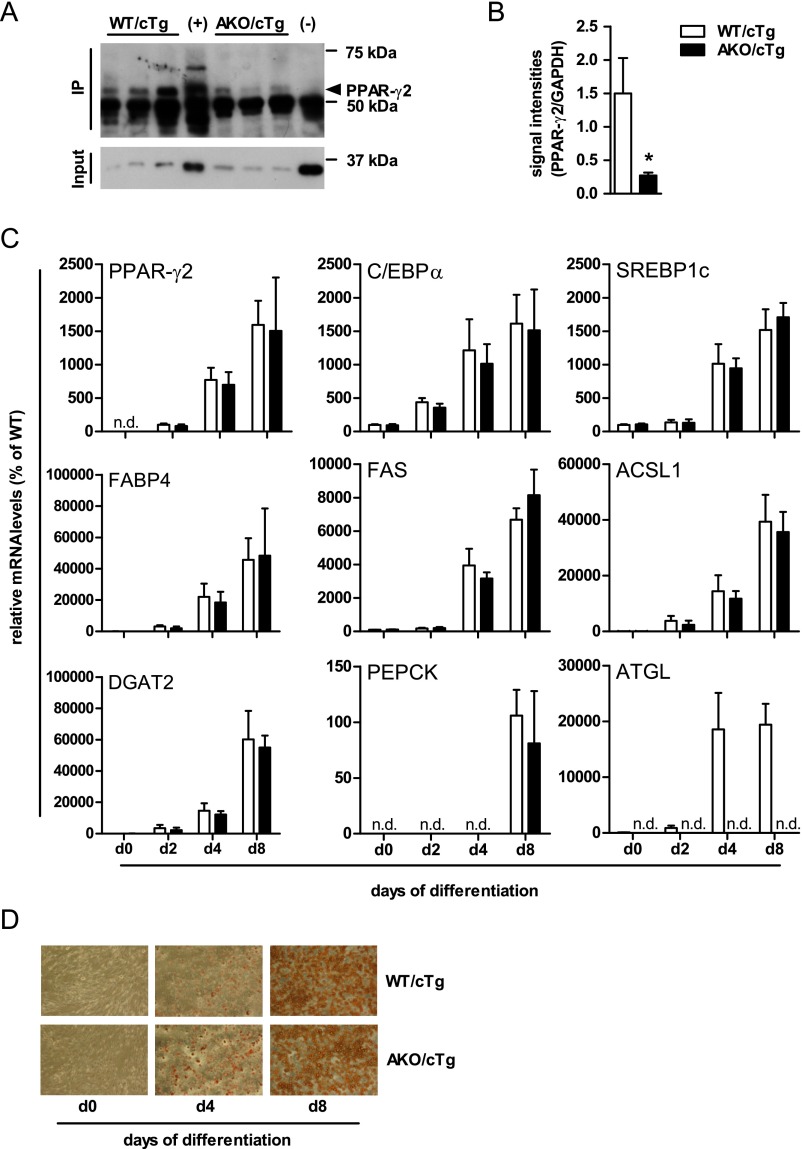
Fig. S5.
Reduced PPAR-γ2 protein expression but adipocyte differentiation is intact. Western blot (A) and quantification (B) of PPAR-γ2 immunoprecipitation from gWAT [n = 3; (+) = WT PPAR-γ2 and (-) = PPAR-γ2–deficient iWAT; Input = α-GAPDH immunblot]. Gene expression (C) and light microscopy (D) of SVF cells upon oil red O staining (100× magnification) during differentiation. n = 3 independent experiments. Values are means ± SD. Student’s unpaired t test. *P < 0.05, **P < 0.01, ***P < 0.001; n.d. not detectable.

