Fig. 6.
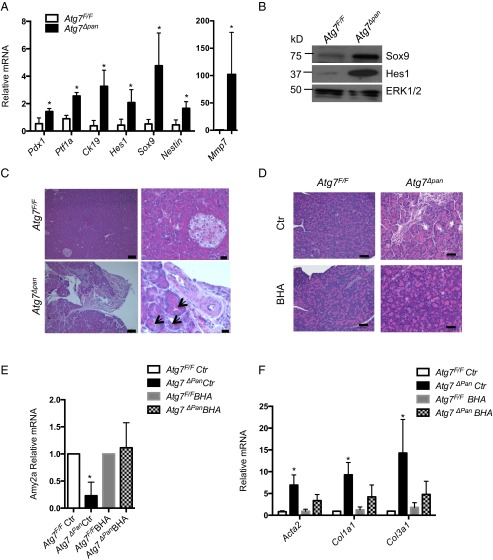
Acinar-to-ductal metaplasia and role of oxidative stress in Atg7Δpan pancreatitis. (A) Relative mRNA expression of indicated genes determined by qPCR. Results are means ± SEM of triplicates. n = 3 mice per condition. *P < 0.05 vs. Atg7F/F. (B) Sox9 and Hes1 in total pancreatic lysates of 12-wk-old mice. (C) H&E staining of pancreatic sections from 12-wk-old mice. ADM-like structures indicated by arrows. [Scale bars, 100 μm (Left) and 20 μm (Right).] (D) H&E staining of pancreatic tissue sections from 12-wk-old Atg7F/F and AtgΔpan mice fed with BHA-containing (0.7%) diet (BHA) or normal chow (Ctr) for 4 wk. (Scale bars, 50 μm.) (E and F) mRNA analysis of the indicated genes in total pancreata samples treated as described in D. Results are means ± SEM of triplicates. n = 4 mice per condition. *P < 0.05 vs. Atg7F/FCtr.

