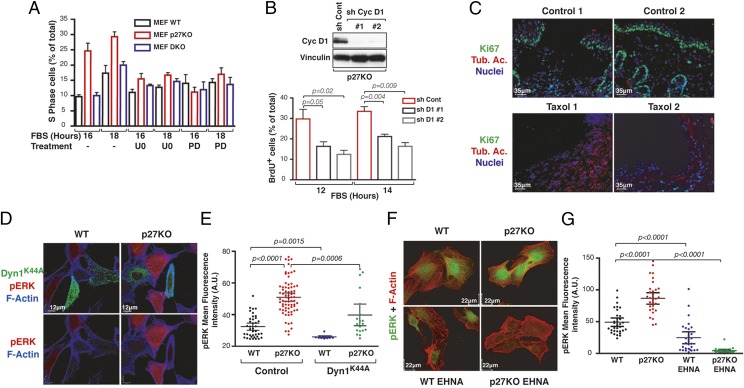
Fig. 4.
Relative p27/stathmin expression levels control cell cycle progression via MT-dependent vesicle transport. (A) Percentage of S-phase in MEFs serum-starved and stimulated with 10% FBS, with or without U0126 (U0) or PD0332991 (PD), for the indicated times. (B) Percentage of BrdU incorporation of 3T3 p27KO, silenced for cyclin D1 expression, serum-starved and then stimulated with 10% FBS for the indicated times. The probability value was calculated by the Student’s t test. (Upper) Cyclin (Cyc) D1 expression in control (sh Cont) and silenced (sh Cyc D1) cells is reported. Vinculin was used as a loading control. sh, short hairpin RNA. (C) Immunofluorescence analyses of Ki67 (green) and acetylated tubulin (Tub. Ac., red) in excisional wounds of the skin from p27KO mice treated with vehicle (control) or taxol (5 mg/kg). Typical images from two different mice per group are shown. Nuclei are stained with propidium iodide (pseudocolored in blue). (D) Immunofluorescence analyses of pERK1/2 (red) and F-actin (blue) in WT and p27KO fibroblasts, transfected with EGFP-dynamin1K44A (DynK44A) mutant (green) and stimulated with 10% serum (FBS) for 15 min. (E) Graph reports the quantification of pERK1/2 staining shown in D. (F) Immunofluorescence analyses of pERK1/2 (green) and F-actin (red) in WT and p27KO fibroblasts, treated or not with erythro-9-(2-Hydroxy-3-nonyl)adenine (EHNA) hydrochloride and then stimulated with serum for 5 min. (G) Graph reports the quantification of pERK1/2 staining shown in F. In E and G, each dot in the graph corresponds to one analyzed cell. Significant differences were calculated using the Mann–Whitney unpaired t test.

