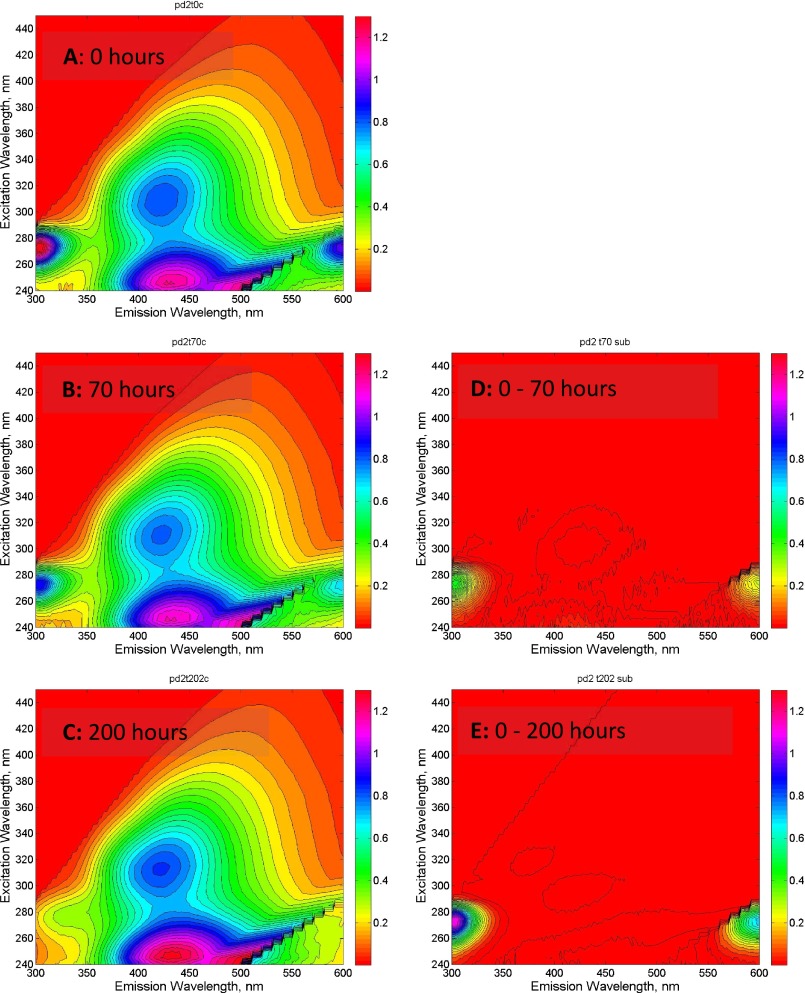
Fig. S2.
Fluorescence excitation/emission matrices (EEMs) for a representative permafrost DOC incubation. EEMs measured at 0 h (A), 70 h (B), and 200 (C) are shown on the Left, whereas subtraction EEMs illustrating the change in fluorescence after 70 h (D) and change after 200 h (E) are on the Right. Note the loss of the peak at emission of 310/excitation of 275 over time.

