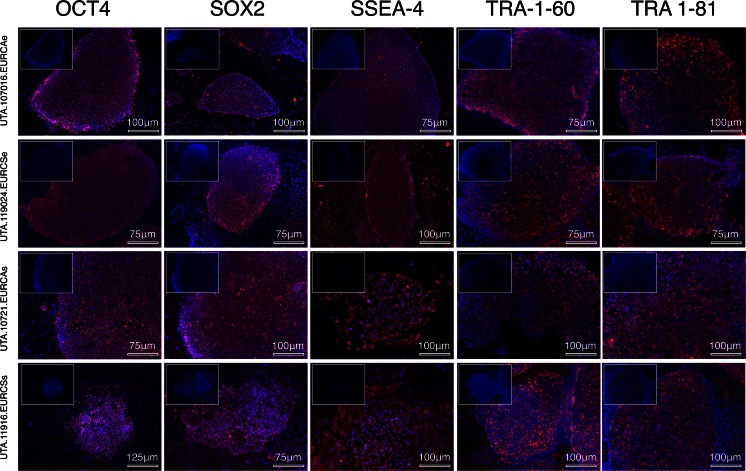
Fig. 4.
Immunocytochemical staining for pluripotency markers of iPSCs colonies. The expression of pluripotency genes in the iPSC lines was studied at the protein level by immunocytochemical staining. Images are composite of DAPI (blue) and specific signal (red) for OCT-4, SOX2, SSEA-4, TRA 1-60 and TRA 1-81 pluripotency markers. DAPI signal alone is shown, as a reference for each staining, in the upper left corner

