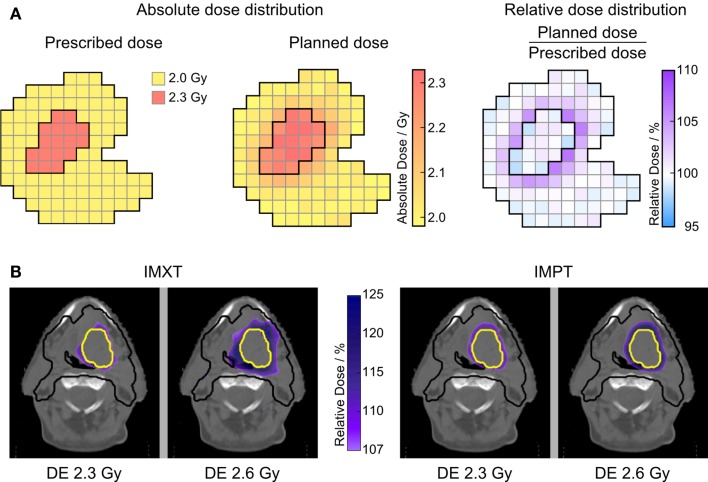
Figure 1.
Relative dose distributions. (A) Illustration of calculating the voxel-wise relative dose distribution, exemplarily for DE level of 2.3 Gy. For the high DE level, the SIB volume is normalized to 2.6 Gy in the same way. (B) Relative dose distribution in the elective target only showing high-dose areas outside ICRU constraints (>107%). All four SIB treatment plans for one patient are shown for series I treatment, illustrating the larger high-dose rim around the SIB volume for the high DE level of 2.6 Gy. PTVelec is outlined in black, GTVSIB-I in yellow.

