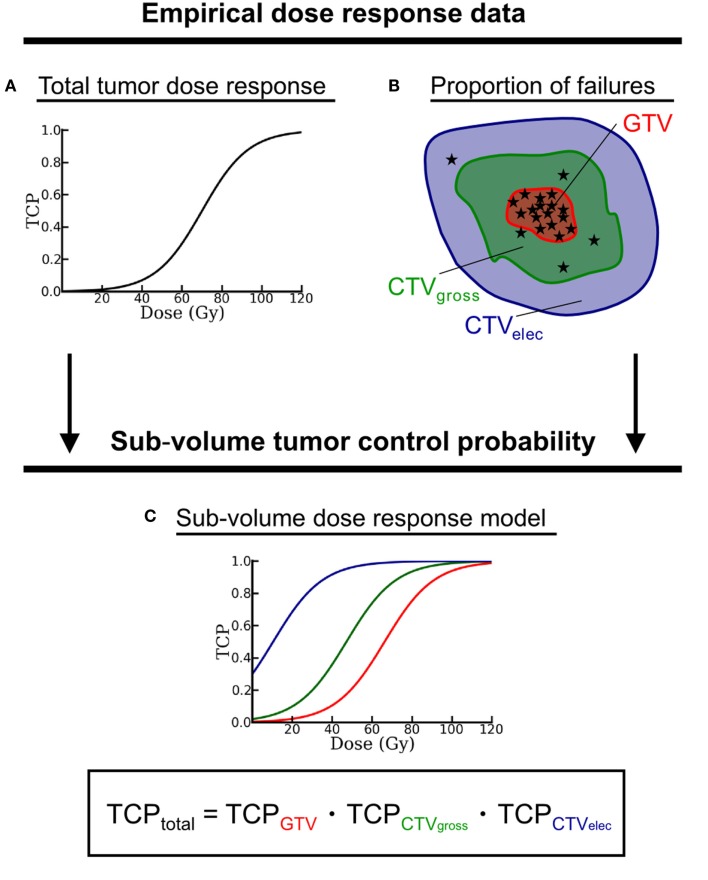
Figure 2.
Schematic drawing of the sub-volume TCP model approach. Empirical dose–response data from comparable patient cohorts – given as (A) dose–response curve and (B) spatial distribution of local failures (represented by the asterisks) – serve as input to generate (C) one dose–response curve for each target sub-volume. The total TCP results from the product of all sub-volume TCP. Note, all target sub-volumes have to be disjoint. Therefore, inner sub-volumes are excluded from outer encompassing structures.

