Figure 3.
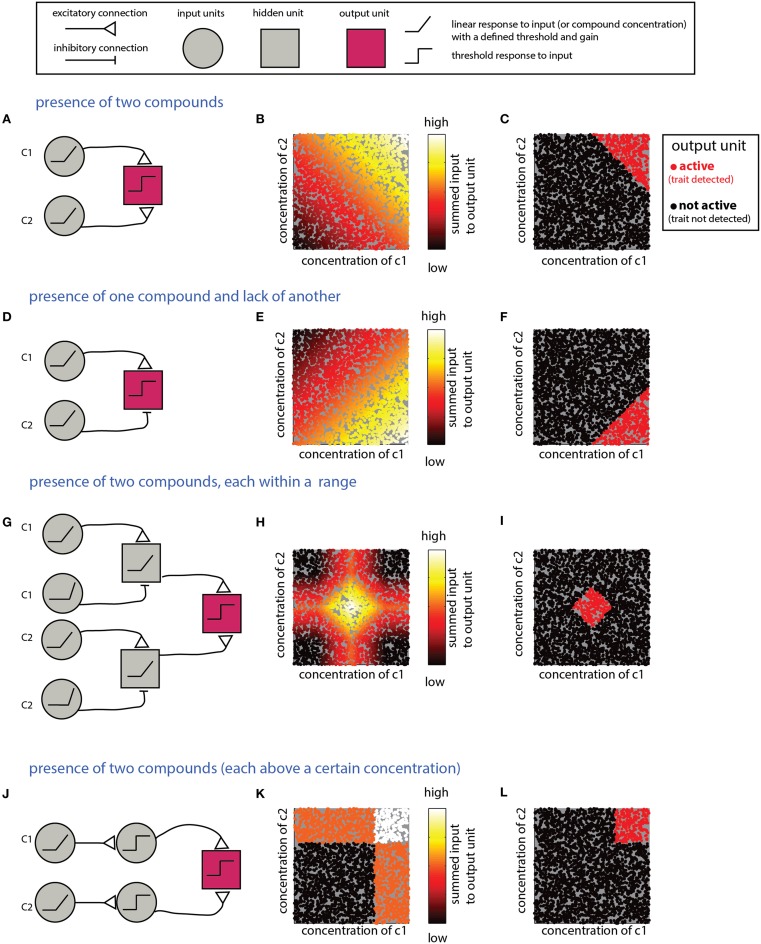
Detection of multiple (two) compounds. (A–C) Detection of the sum of two compounds. (A) A simple network that detects the presence of two compounds c1 and c2. The network comprises two linearly responding units that feed into a third integrating unit. (B) Inputs into the output unit in the network in (A) as a function of the levels of c1 and c2. The magnitude of the inputs is indicated by the color of the dots (arbitrary units). (C) Activity of the output unit after thresholding the input shown in (B). (D–F) Detection of a difference between two compounds. Here, the output unit receives an excitatory input from a unit that detects c1 and an inhibitory input from a unit that detects c2. Assuming that the input units' response functions and efferent connections are similar, the output unit be active when c1 is larger than c2. (G–I) Detection that each of two compounds is within a specific range. (G) The output unit in this network receives inputs from two range-detecting units as shown in Figure 2A (with each network sensitive to the range of one of the compounds). (H) Input to the output unit in (G). (I) Output of the output unit in (G) after thresholding. (J–L) A network that detects that each of two compounds is above some threshold. Similar modifications can be applied to all the other networks in this section, to impose conditions on each of the compounds. Legend at top explains network elements.

