Figure 5.
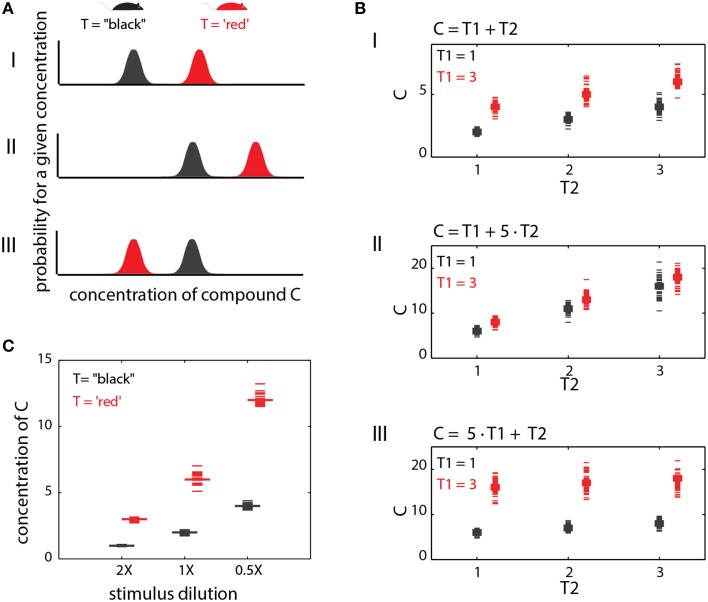
Context effects. (A) Context dependent changes in compound distributions. This example illustrates a single cue with a different distribution under two trait (T) values. (AI) shows a baseline condition where the two distributions are non-overlapping. A simple threshold can be set to distinguish the trait values (T = “black” vs. T = “red”) based on the level of (C). In (AII), both distributions are shifted. The threshold used in (AI) will no longer yield reliable discrimination among the two traits. (AIII) the relationships between compound levels and trait values are reversed. Here, the red trait is associated with lower values of (C). (B). Interaction between two different traits in determining compound levels. The first trait (T1) can take one of two values (1 or 3), while the second can take the values 1, 2, or 3. In (BI), both traits exert an equal influence on the levels of (C), which is simply their sum. In (BII), the influence of T2 is dominant, while in (BIII), T1 dominates. (C) Effect of dilution on specific compound levels. The example illustrates how different dilutions can confound trait identification.

