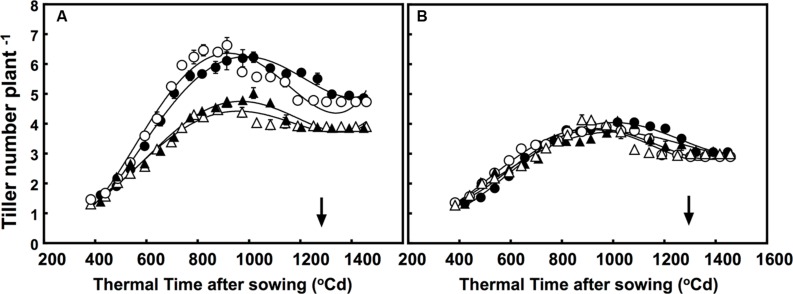
FIGURE 1.
Dynamics of tillering in the (A) free-tillering (FT) and (B) restricted-tillering (RT) sister lines. Black triangles = ACO2 + HT; white triangles = ACO2 + AT; black circles = ECO2 + HT; and white circles = ECO2 + AT. Arrows indicate time of anthesis. Each point is mean ± SEM of 10 replicates.

