Figure 1.
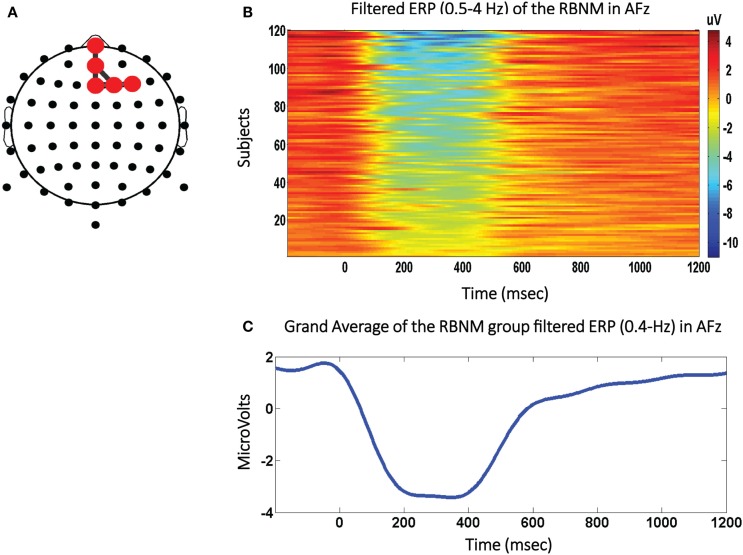
The negative shift biomarker. (A) The Reference Brain Network Model (RBNM) is displayed on the right side. The red dots represent delta band activations recorded from fronto-midline electrodes (FPz, AFz, and Fz) and from electrodes on the right side (F2 and F4). (B) The colored panel depicts individual peak activations recorded from each of 120 subjects included in the RBNM. (C) The delta band-passed grand average (120 subjects). The negative peak was most prominent during the ~200–400-ms interval observed at the electrodes included in the RBNM (A).

