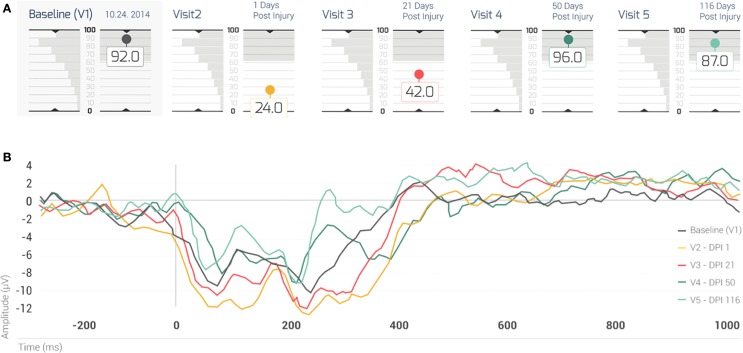
Figure 2.
(A) The BNA scores of the case for his five visits. The shaded box indicates the test–retest 1 SD of the change between two visits, for a group of 41 normal healthy subjects (i.e., the normal range of change). Note that his BNA scores for visits 2 and 3 (1 and 21 days post concussion, respectively) fall outside of the normal range of change. Each visit is color coded: baseline (visit 1): black; visit 2: brown; visit 3: red; visit 4: dark green; and visit 5: light green. (B) The case’s ERP grand average waveforms recorded at the AFz channel. Note that each waveform is associated with a different visit (visits 1–5, respectively) and that the waveforms were color coded in the same manner as the visits in (TOP). EDI = elapsed days from injury; V = visit.

