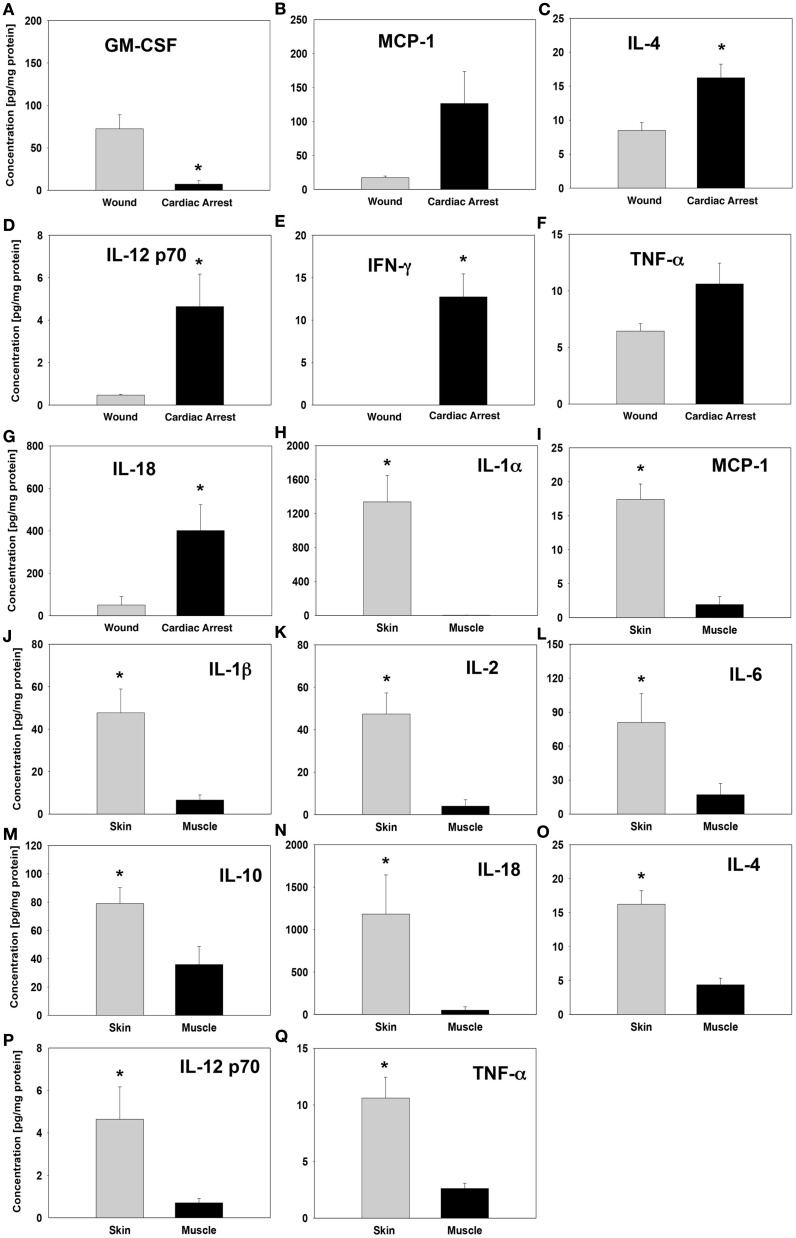
Figure 3.
Cytokine levels in “wound group” vs. “cardiac arrest group” and in skin vs. muscle tissue. Tissue protein-normalized cytokine concentrations in “wound group” vs. “cardiac arrest group” (A–G) and in skin vs. muscle tissue (H–Q). The concentrations of each cytokine were measured by Luminex™ as described in Section “Materials and Methods” and are expressed in picogram per milligram total protein. *P < 0.05 by one-tail heteroscedastic t-test.

