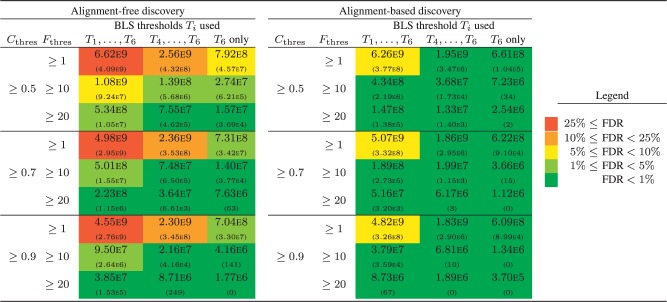
Fig. 2.
Number of genome-wide conserved motifs for both alignment-based and alignment-free discovery for different values of and and different subsets of the six BLS thresholds Ti ( and ). Top number: real Monocot dataset; bottom number between brackets: random dataset (zeroth-order Markov model). The colors represent the false discovery rate (see legend)

