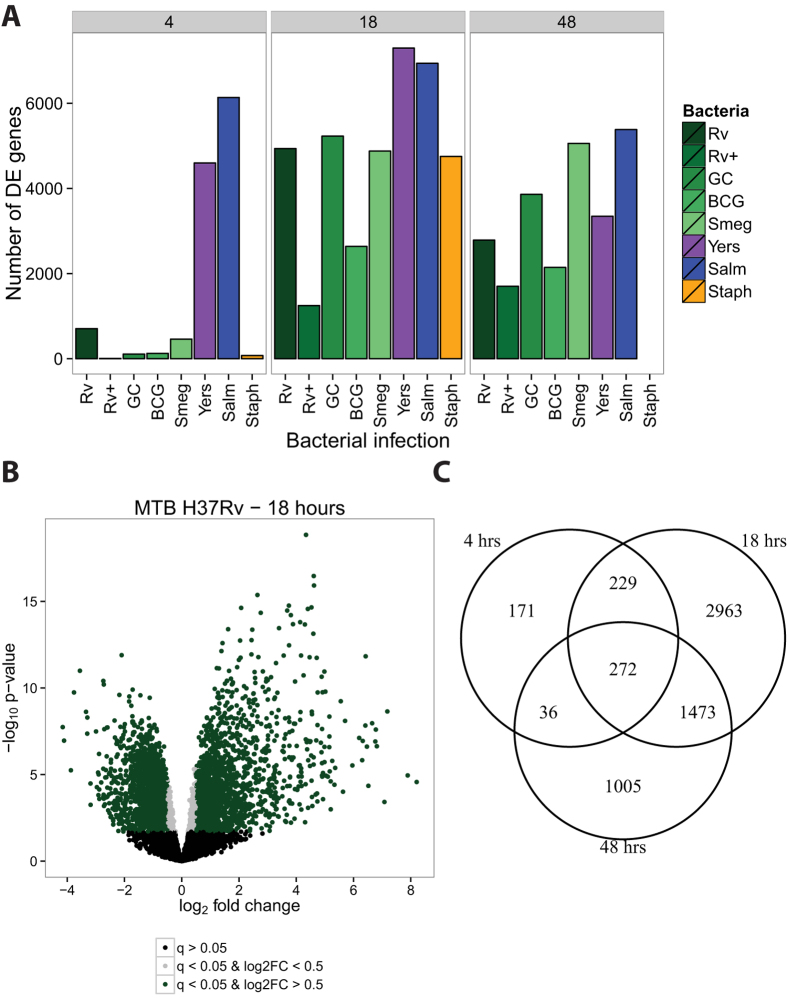
Figure 1. Differential expression analysis.
We tested for differentially expressed genes for each bacterial infection by comparing it to its time-matched control. (A) We classified genes with q-value < 5% as differentially expressed. The mycobacteria are labeled in shades of green. (B) As expected, there were large transcriptional changes 18 hours post-infection with MTB H37Rv. Genes with q-value < 5% and absolute log2 fold change greater than 0.5 are labeled green, those with q-value < 5% and absolute log 2 fold change less than 0.5 are labeled grey, and non-differentially expressed genes are labeled black. (C) The overlap in differentially expressed genes identified at 4, 18, and 48 hours post-infection with MTB H37Rv.

