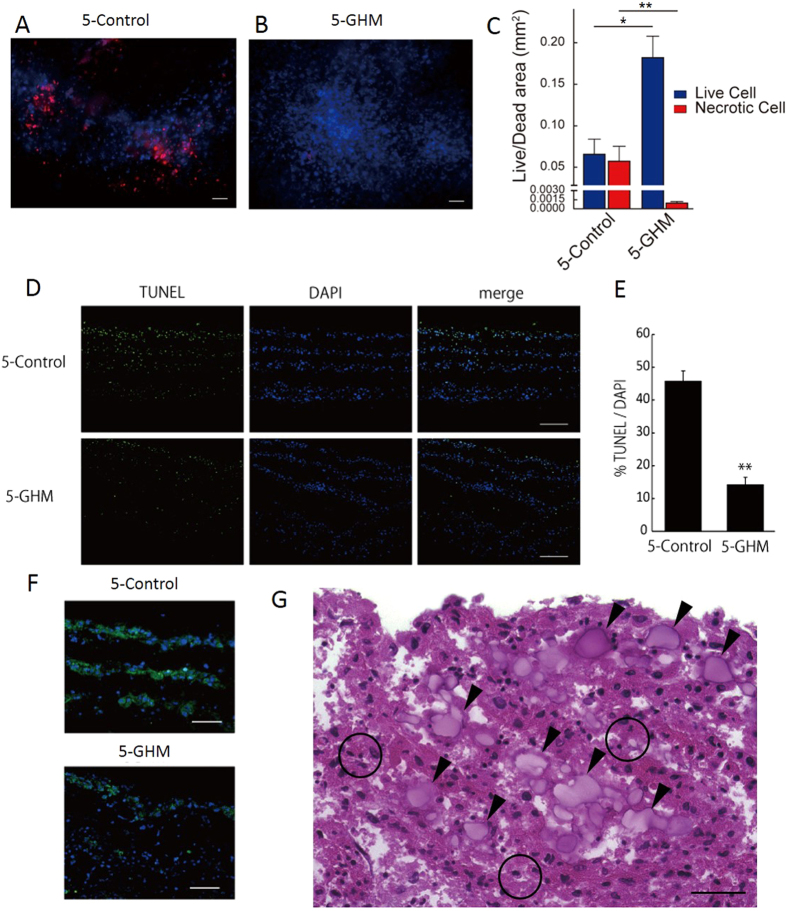
Figure 3. Mechanisms and roles of GHM insertion.
(A,B) Live/Dead assay after 7-day culture. Live cells (blue), necrotic cells (red). (C) Areas in cross sections. **P < 0.01, *P < 0.05 (Mann-Whitney U test, n = 4). Scale bars, 50 μm. (D,E) TUNEL assay. (D) TUNEL staining in cross sections after 7-day culture. TUNEL (green), DAPI (blue). Scale bars, 100 μm. (E) Percentage of TUNEL-positive cells in total cells (DAPI). **P < 0.01 (Mann-Whitney U test, 5-control, n = 4; 5-GHM, n = 3). (F) HIF1α immunostaining after 7-day culture. HIF1α (green), DAPI (blue). Scale bars, 50 μm. (G) A higher magnification view of Fig. 2B. Arrowheads indicate GHMs. Open circles indicate direct contacts between one cardiovascular sheet and the other. Scale bar, 30 μm. All photos are taken with x200 magnification.

