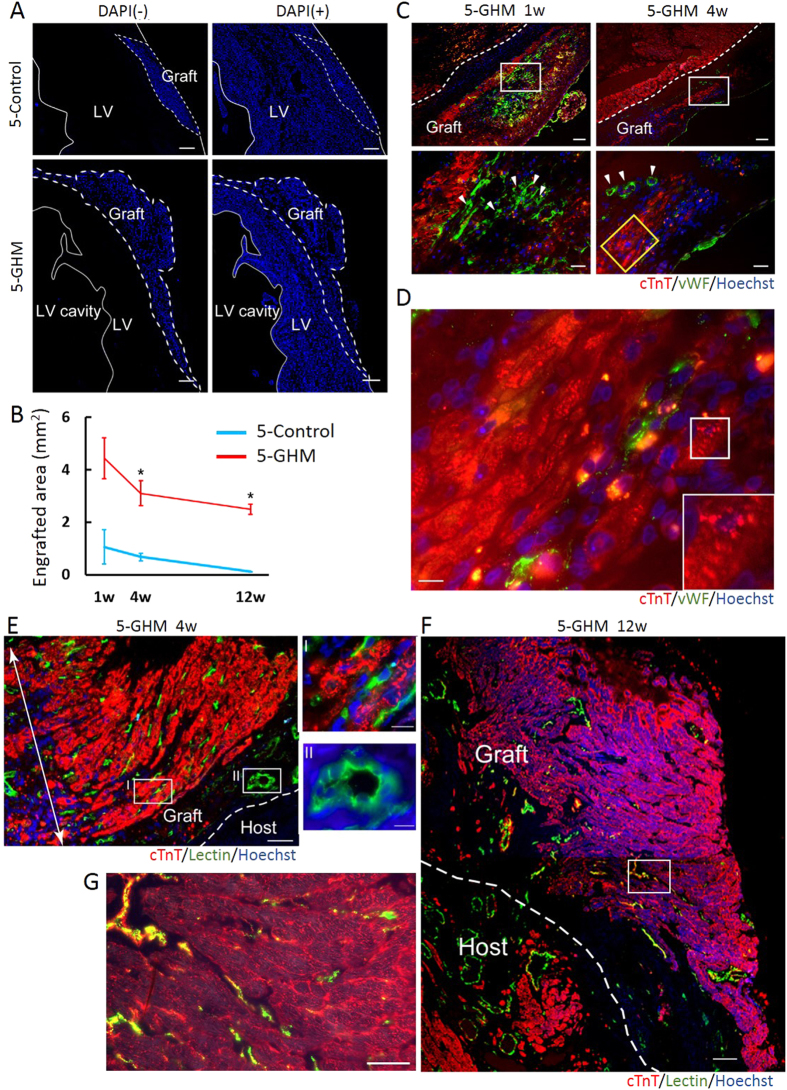
Figure 6. Engraftment status of sheet constructs.
(A) Nuclei staining images (blue) for pre-stained Hoechst (grafts, left) and DAPI (total cells, right). White dashed lines indicate graft areas. Magnifications, x40. (B) Quantitative evaluation of engrafted areas. Mean ± s.e.m. **P < 0.01, *P < 0.05 (Mann-Whitney U test, 1 week: 5-Control, n = 4; 5-GHM, n = 7; 4 weeks: 5-Control, n = 4; 5-GHM, n = 5; 12 weeks: 5-Control; n = 4, 5-GHM; n = 4). (C) Immunofluorescence staining for cTnT (red) and vWF (green) of heart sections 1 (left) and 4 (right) weeks after TX of 5-GHMs. Lower panels: high-magnification images (x400) of white boxes in upper panels (x100). White arrowheads: blood vessel formation with vWF-positive cells. Clear vascular-like structures were formed at 4 weeks. (D) High-magnification image (x1000) of yellow box in (C). Inset: immature sarcomere formation in white box in (D). (E,F) Connection of grafts with systemic circulation. CMs (cTnT, red), perfused vessels (lectin-stained, green), pre-stained graft nuclei (Hoechst, blue). (E) Four weeks after TX. Note that thick neo-CM layers (>20 layers; white double-headed arrow) supported by dense perfused capillary networks (green) were formed. Magnification, x200. Capillaries (I) and larger vessels (II) in the graft (green) were largely Hoechst-positive. Magnification, x1000. (F) Twelve weeks after TX. A Large graft (>0.8 mm thickness, >40 cardiac cell layers, in maximum) survived. Magnification, x200. (G) High-magnification image (x400) of white box in (F). A compact CM tissue with capillary vessels was formed. Scale bars, 300 μm (A), 100 μm (C, upper and F), 50 μm (E,G), 30 μm (C, lower), and 10 μm (D, E-I and II).

