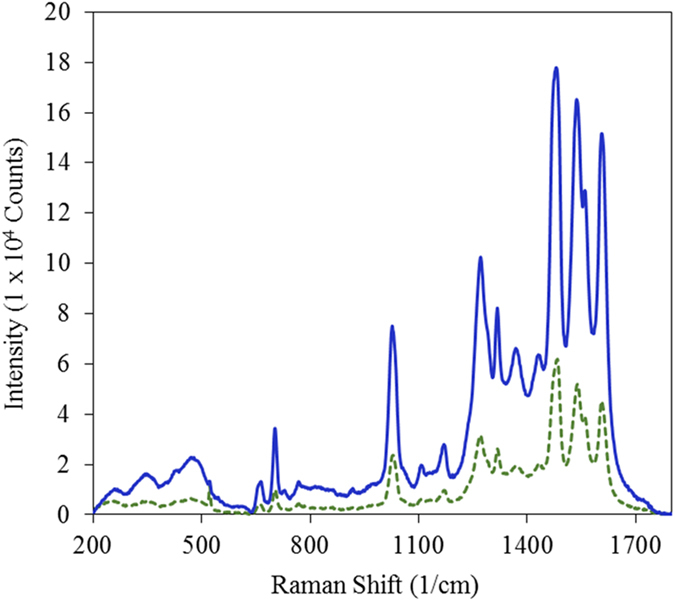
Figure 5. Surface-enhanced Raman spectroscopy.

Spectra taken of N719 dye on Ag nanorods with no seed layer (green dotted) and with In 5 nm seed layer (solid blue).

Spectra taken of N719 dye on Ag nanorods with no seed layer (green dotted) and with In 5 nm seed layer (solid blue).