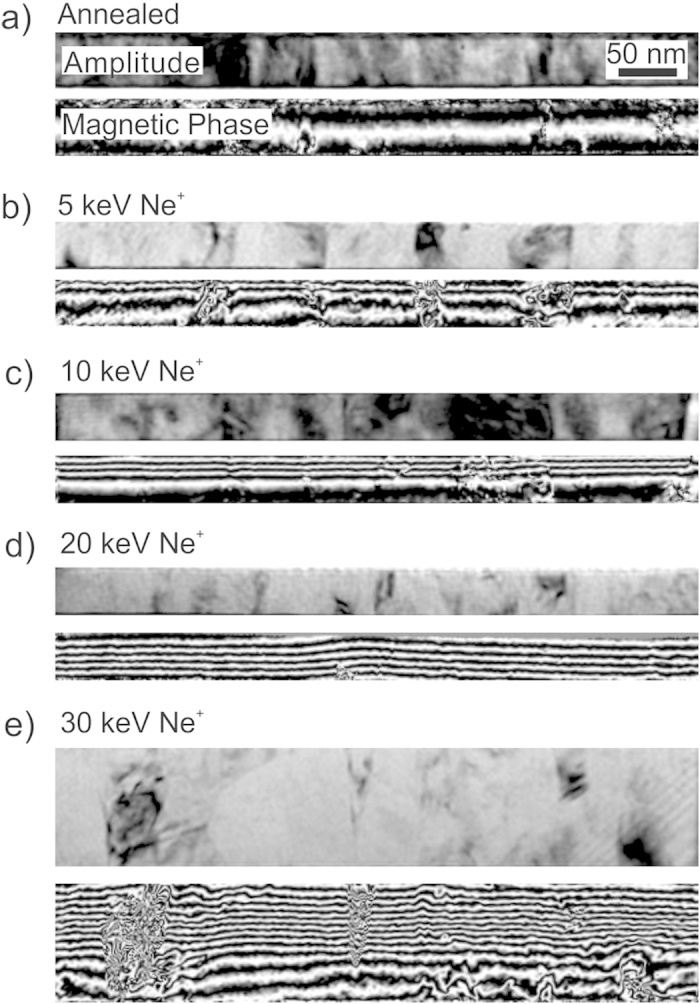
Figure 2. Magnetic flux lines induced by ion-irradiation of Fe60Al40.

Amplitude images show structural information whereas the corresponding magnetic phase (φmag) images show the distribution of magnetic flux lines. The Fe60Al40 thin films were annealed at 773 K in vacuum prior to ion irradiation, and (a) shows the amplitude and magnetic phase for the annealed film. The annealed films were irradiated with Ne+ ions at energies of (b) 5, (c) 10, (d) 20, and (e) 30 keV. The Ne+ fluence is 6 × 10¹⁴ ions cm−2. The films in (a–d) are 40 nm thick, and 100 nm thick in (d). Magnetic flux lines have been visualized by plotting the spatial variation of the cosine of the magnetic phase shift, cos(φmag). To enhance contrast and compensate for different thicknesses of the cross-sections, φmag has been amplified by a factor i.e., the plots show (a) cos(5.2φmag) (b) cos(20.7φmag) (c) cos(6φmag) (d) cos(12φmag) and cos(22.2φmag).
