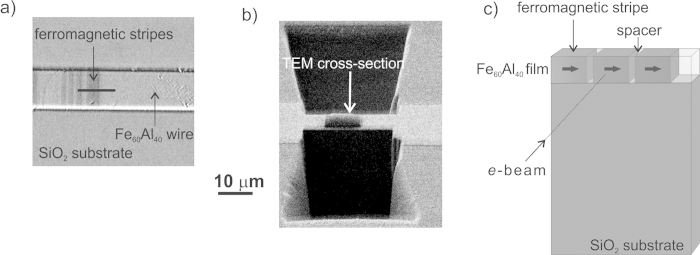
Figure 3. Magnetic stripe pattern and cross-sectioning.
(a) Magnetic contrast image obtained using Kerr effect of a 10 μm wide Fe60Al40 wire onto which magnetic stripes have been patterned using a nano-focussed Ne+ ion beam. The patterned regions appear as dark contrast, and consist of bunches of 5 stripes separated by 100 nm wide spacings. A region containing 500 nm wide stripes was selected for cross-sectioning, indicated by the solid black line. (b) Scanning Electron Microscopy image of the TEM cross-section prior to extraction. (c) Schematic of the extracted cross-section. The block arrows indicate the direction of magnetization prior to holographic imaging.

