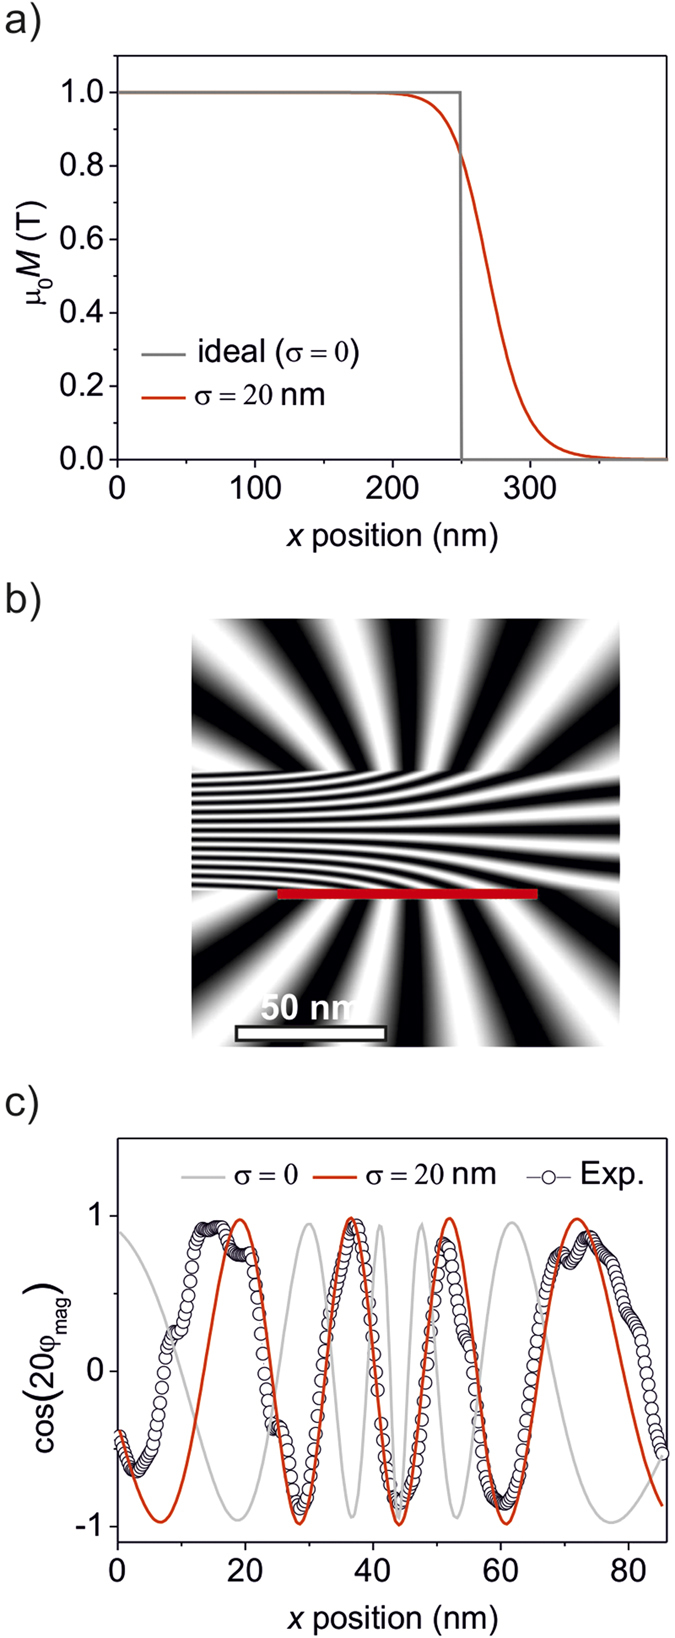
Figure 6. Simulation of the flux lines at a magnetic edge.

(a) The ideal magnetization profile (grey) at the edge of a patterned ferromagnetic stripe, and the profile considering a lateral scattering  of 20 nm (red). (b) Simulation of the ferromagnetic edge shown in a) for the case of lateral ion-scattering. (c) Flux-density variation along the solid line in (b) where
  = 20 nm, the corresponding variation for
  = 0 and the experimentally observed flux-density variation are plotted along this line.
