
FIGURE 3.
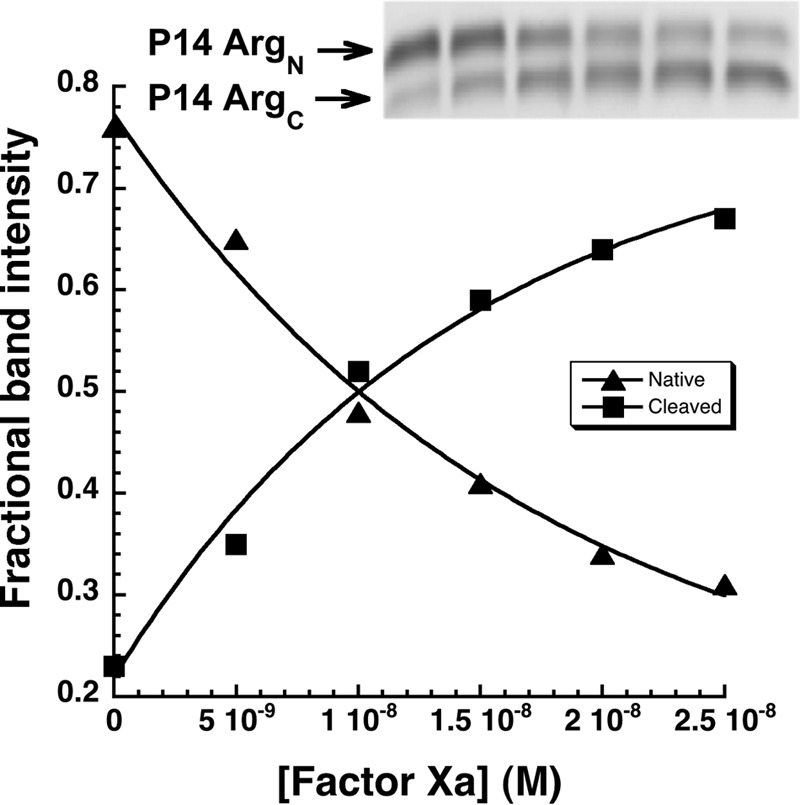
Reaction of antithrombin P14 Arg variant with factor Xa. SDS-PAGE analysis of the substrate reaction of 700 nm antithrombin P14 Arg variant with 0, 5, 10, 15, 20, and 25 nm factor Xa (lanes from left to right) for 5 min as described under “Experimental Procedures.” The graph shows fractional band intensities of native (P14 ArgN) and RCL-cleaved inhibitors (P14 ArgC) that were quantified with imaging software and plotted as a function of factor Xa concentration. Solid lines are fits of the changes in band intensity by a single exponential function to obtain kcat/Km for the reaction.