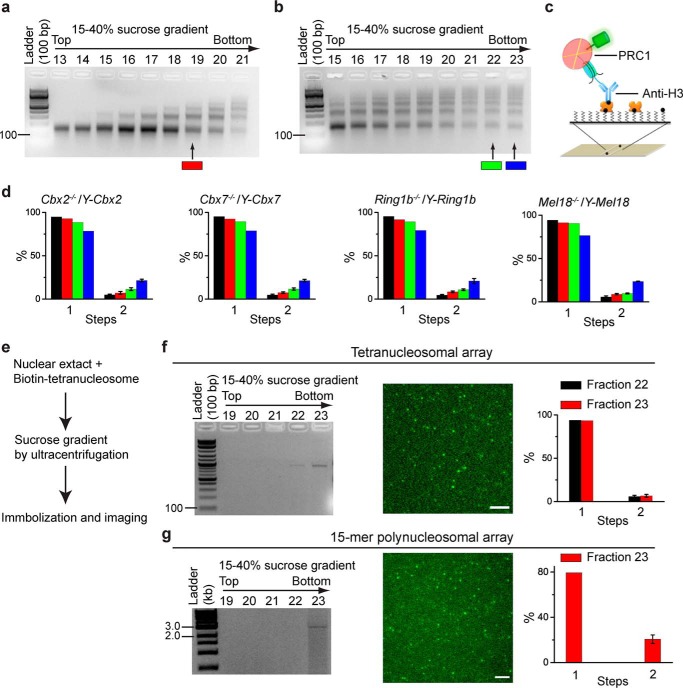
FIGURE 5.
Cellular assembly stoichiometry of YFP-PRC1 proteins on a polynucleosomal array. a and b, agarose gel electrophoresis analysis of nucleosomal DNAs extracted from fractions of 15–40% sucrose gradient. Nucleosomes were prepared from Cbx2−/−/Y-Cbx2, Cbx7−/−/Y-Cbx7, Ring1b−/−/Y-Ring1b, and Mel18−/−/Y-Mel18 mES cells. Representative images of agarose gel are shown. Fractions 19, 22, and 23 indicated by color-coded bars below the gels were used for single-molecule TIRF imaging. c, schematic depiction of the immobilization of YFP-PRC1·nucleosome complex on the surface by biotinylated anti-H3 antibody. d, percentage of fluorescence photobleaching steps of YFP-Cbx2, YFP-Cbx7, YFP-Ring1b, and YFP-Mel18 on a polynucleosomal array. The color-coded bars are described in a and b. The black bar indicates the percentage of photobleaching steps of YFP-PRC1 proteins on a mononucleosome, which is replicated from Fig. 3b. Results are means ± S.D. e, flow diagram describes the approach used for analyzing the assembly stoichiometry of YFP-Ring1b·PRC1 complex on a reconstituted tetranucleosomal array (f) and a 15-mer polynucleosomal array (g). f and g, agarose gel electrophoresis analysis of nucleosomal DNAs extracted from the fractions indicated above the gel (left). Representative single images of the acquired sequences are shown (middle). The percentage of fluorescence photobleaching steps for samples from fractions indicated is shown. Results are means ± S.D. Scale bar, 5 μm.

