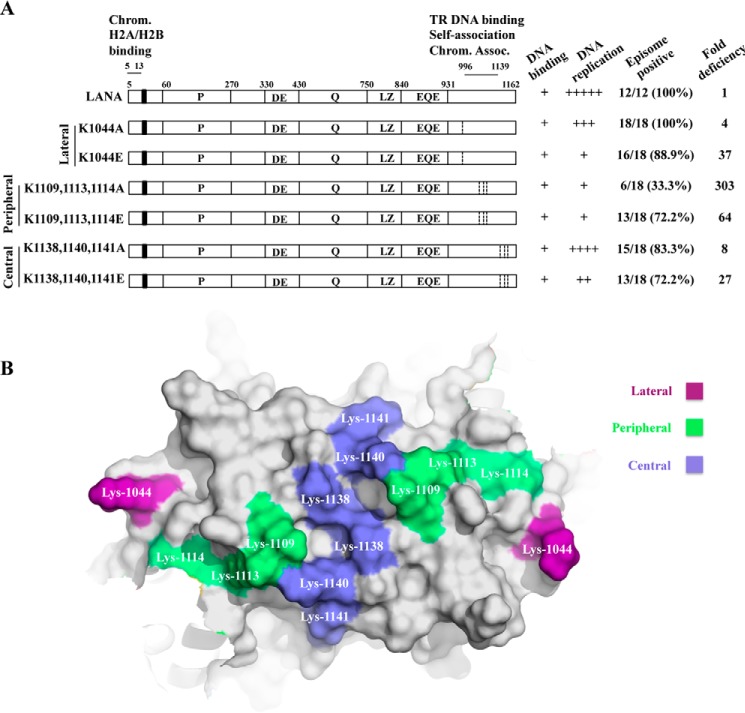
FIGURE 1.
LANA dorsal positive patch mutants. A, a schematic diagram is shown of LANA and LANA mutants. The proline-rich region (P), aspartate and glutamate (DE) region, glutamine (Q) region, putative leucine zipper (LZ), and glutamate and glutamine region (EQE) are indicated. The N-terminal nuclear localization signal is indicated by a wide vertical bar. Residues 5–13 bind the surface of histones H2A/H2B. LANA 996–1139 self-associates to bind TR DNA and can also independently associate with mitotic chromosomes. Capabilities for DNA binding, DNA replication, episome maintenance, and -fold deficiency for episome maintenance are summarized at the right. Ratios indicate the number of G418-resistant cell lines that contain episomes over the total number of G418-resistant cell lines tested by the Gardella gel, and percentages are shown in parenthesis. The numbers used for the ratios were derived from two independent experiments. -Fold deficiency was determined based on comparisons of the calculated numbers of cells necessary to seed per microtiter well to obtain episome containing cell outgrowth in 63.2% of wells. B, surface representation of the positively charged dorsal patch of a dimer of the KSHV LANA DBD (PDB ID code 2YPY) (47) viewed in PyMOL (v.0.99; Schrödinger). The lateral, peripheral, and central regions of the electrostatic patch are colored purple, green, and blue, respectively, and individual residues are indicated.

