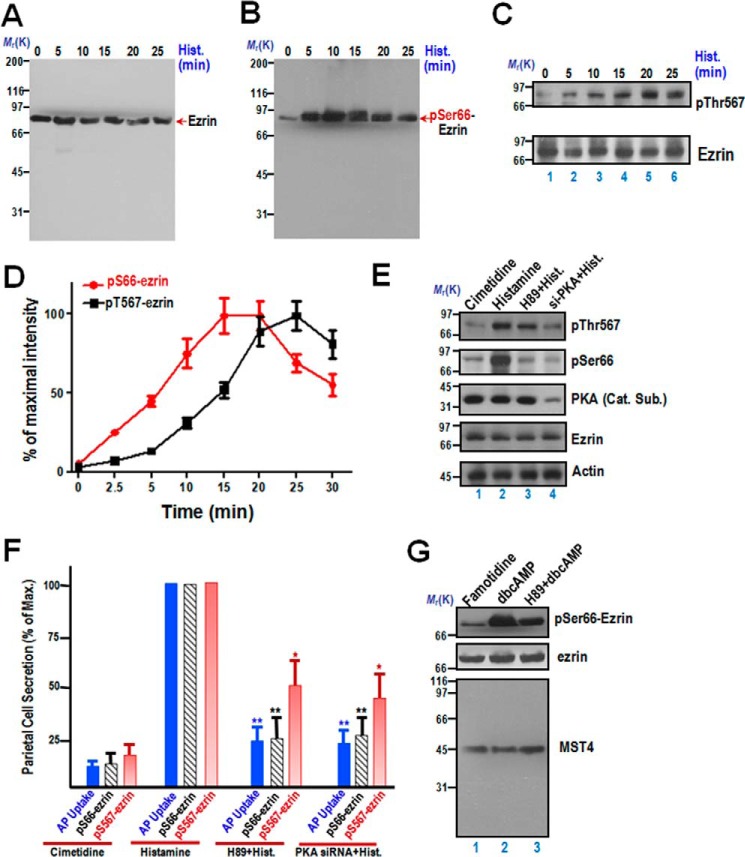
FIGURE 1.
Phosphorylation of ezrin at Ser-66 and Thr-567 exhibits distinct temporal dynamics during parietal cell activation. A, aliquots of samples from resting and stimulated gastric glands were harvested at the indicated intervals after treatment as described under “Materials and Methods.” The protein samples were separated by SDS-PAGE and transferred onto a nitrocellulose membrane. The nitrocellulose membrane was probed with the anti-ezrin mouse monoclonal antibody 6H11 as described previously (e.g. Refs. 3, 23). Note that the monoclonal antibody 6H11 is specific and recognizes essentially a single band at 80 kDa. Hist., histamine. B, samples were prepared exactly as in A, and the membrane was probed with an anti-phospho-ezrin Ser-66 antibody (pSer66) and developed by ECL. Note that the anti-Ser(P)-66 antibody is specific and recognized essentially a single band at 80 kDa. C, samples were prepared exactly as in A, and the membrane was probed with an anti-phospho-ezrin Thr-567 antibody (pThr567) and developed by ECL. Another membrane from an identical preparation was probed with the anti-ezrin mouse antibody 6H11 as described previously. D, temporal profiles of ezrin phosphorylation at Ser-66 and Thr-567 of activated parietal cells. The stimulation index of Ser(P)-66 (red line) and Thr(P)-567 is expressed as phospho-ezrin intensities over that of ezrin protein from an identical set of samples. The stimulation index was also plotted as a function of time. Error bars represent the mean ± S.E. of three separate preparations. E, characterization of phospho-ezrin as a function of PKA activation. Western blots were probed with an anti-Thr(P)-567-ezrin antibody (first panel), anti-Ser(P)-66-ezrin antibody (second panel), the anti-PKA catalytic subunit (Cat. Sub., third panel), anti-ezrin (fourth panel), and anti-actin antibody (fifth panel). F, correlation of the temporal dynamics of ezrin phosphorylation and acid secretion of parietal cells. The secretory activity of gastric glands was indicated by AP uptake and plotted as quantitative analyses of phosphorylated ezrin levels. *, p < 0.05; **, p < 0.01; significant difference from histamine-stimulated controls. Max., maximal stimulation. G, aliquots of samples from resting and stimulated gastric glands were harvested at the indicated intervals after treatment as described under “Materials and Methods.” Specifically, 5 μm famotidine and 1 mm dbcAMP were used to maintain gastric glands in a non-secreting and secreting status, respectively. In some instances, 10 μm H89 was incubated with an aliquot of gastric glands before dbcAMP treatment. After the aforementioned treatment, the protein samples were separated by SDS-PAGE and transferred onto a nitrocellulose membrane. The nitrocellulose membrane was probed with the anti-ezrin mouse monoclonal antibody 6H11 and Ser(P)-66 antibody as described above. In addition, the membrane was also probed by MST4 antibody as a control. Note that the anti-MST4 antibody from Cell Signaling Technology is specific and recognized essentially a single band at 43 kDa.

