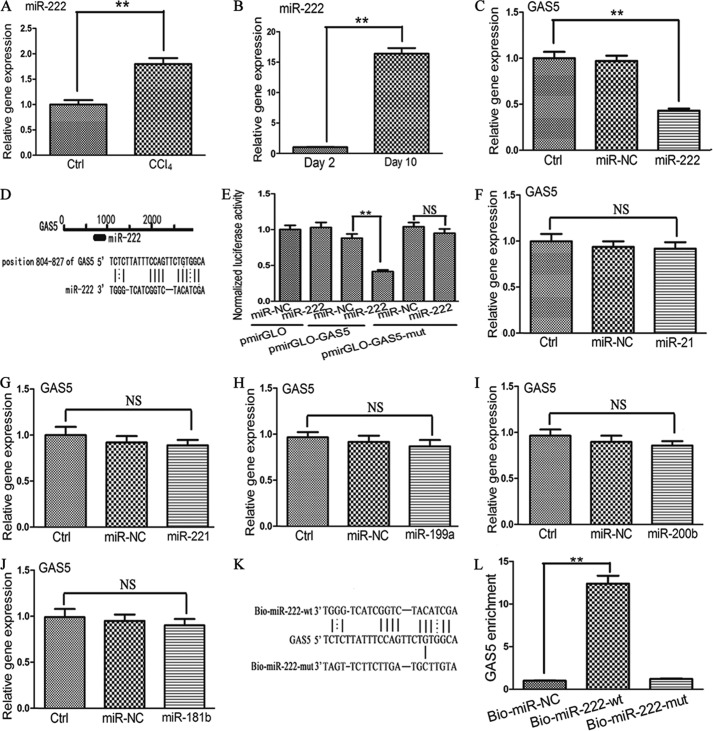
FIGURE 4.
Effect of miR-222 on the level of GAS5. A, relative gene expression of miR-222 in normal liver tissues (n = 9) and fibrotic liver tissues (n = 9). B, the levels of miR-222 in primary HSCs at day 10 and day 2. C, effect of miR-222 on the level of GAS5. D, schematic representation of the miRNA binding sites in the GAS5 sequence based on RNA22 software. E, reporter gene assay to validate the interaction between GAS5 and miR-222 in 293T cells. F, effect of miR-21 on the level of GAS5. G, effect of miR-221 on the level of GAS5. H, effect of miR-199a on the level of GAS5. I, effect of miR-200b on the level of GAS5. J, effect of miR-181b on the level of GAS5. K, schematic diagram of the wild type and mutated form of the miR-222 sequence. L, pulldown assay to validate the direct interaction between GAS5 and miR-222. Bio-miR-NC is not complementary to GAS5. The data are expressed as the means ± S.D. (error bars) of at least three independent experiments. **, p < 0.01; NS, not significant. Ctrl, control.

