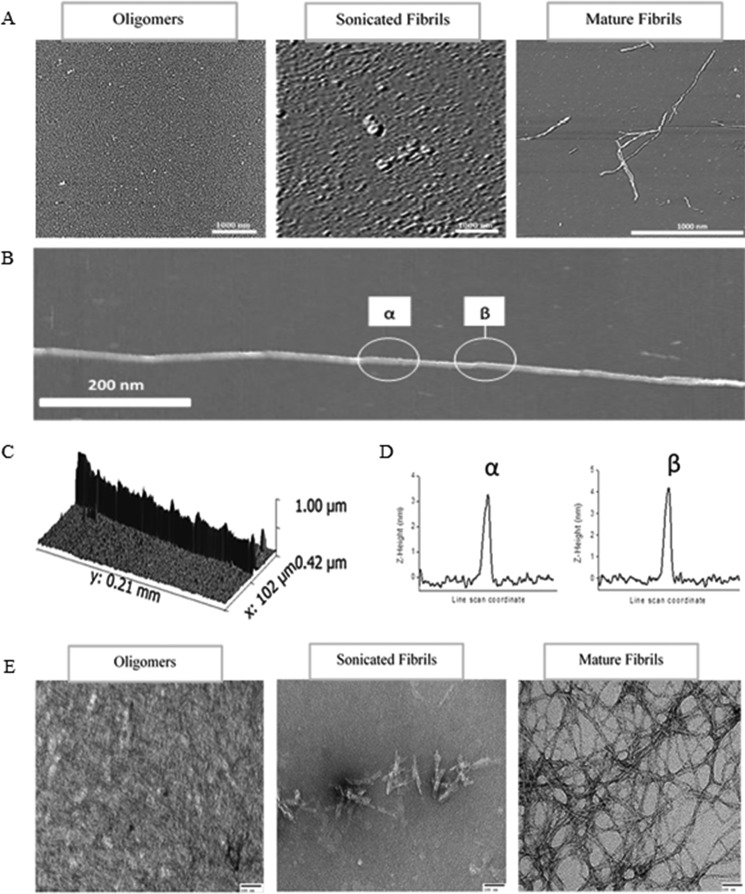
FIGURE 2.
AFM images of amyloid aggregates on mica formed from hen egg lysozyme. A, oligomers, sonicated fibrils, and amyloid mature fibrils visualized using AFM. B, shows a typical z-height AFM image of a fibril using a 1-μm scan range. Fibril fine structure is evident from the periodic steps indicated by the white circles. The periodic steps can also be seen in the three-dimensional image found in C. D, represent z-height line sections on areas of the fibril that are between the step of the periodic structure (α) and through the step itself (β). E, transmission electron microscopy of HEWL samples. Samples represented are oligomers, sonicated fibrils, and mature fibrils. Samples were deposited onto carbon-coated grids and stained with 2% uranyl acetate prior to visualization. These images are representative of three separate experiments.

