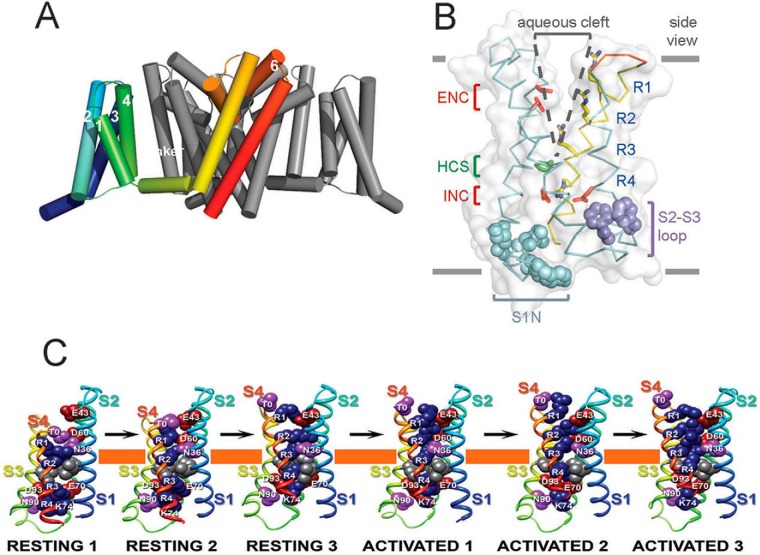
FIGURE 7.
Structure of NavAb. A, side view of NavAb channels with the transmembrane segments of one subunit highlighted in colors. B, side view of the structure of the NavAb voltage sensor in an activated state (53). ENC, extracellular negative cluster (red); HCS, hydrophobic constriction site (green); INC, intracellular negative cluster (red). C, structural transitions during activation of the voltage sensor. Note the steady outward movement of the S4 gating charges from left to right (75).

