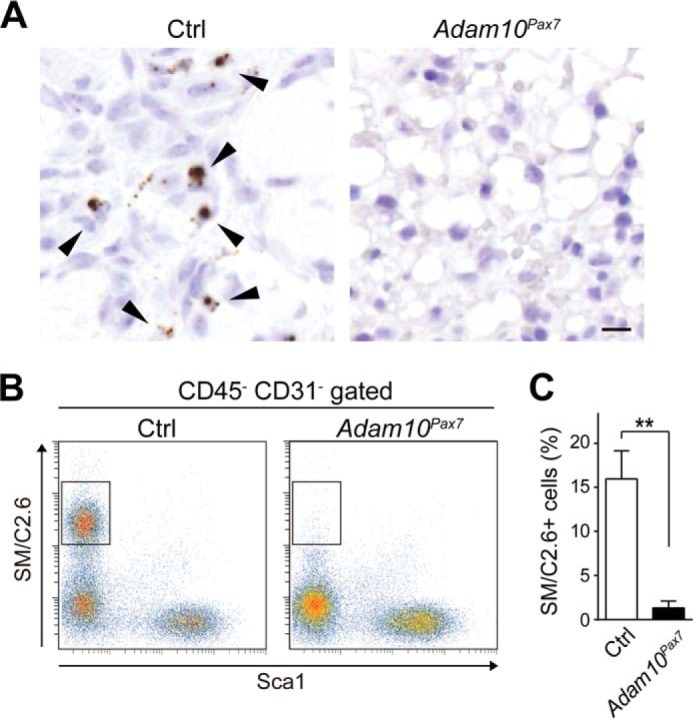
FIGURE 4.

Depletion of SCs in Adam10Pax7 mice. A, sections of the TA muscle taken at 7 DPI from Ctrl and Adam10Pax7 mice probed for Pax7 transcripts and counterstained with Mayer's hematoxylin. The arrowheads indicate Pax7-positive cells. Bar, 10 μm. B, flow cytometric analysis of the SC population using a single-cell suspension prepared from the muscles of uninjured Ctrl and Adam10Pax7 mice (boxed areas). C, percentage of SM/C2.6+ Sca1− cells in the CD45− CD31− gated population of a single-cell suspension collected from the muscles of Ctrl and Adam10Pax7 mice. n = 4 mice for each genotype. Error bars represent S.D. **, p < 0.005.
