FIGURE 2.
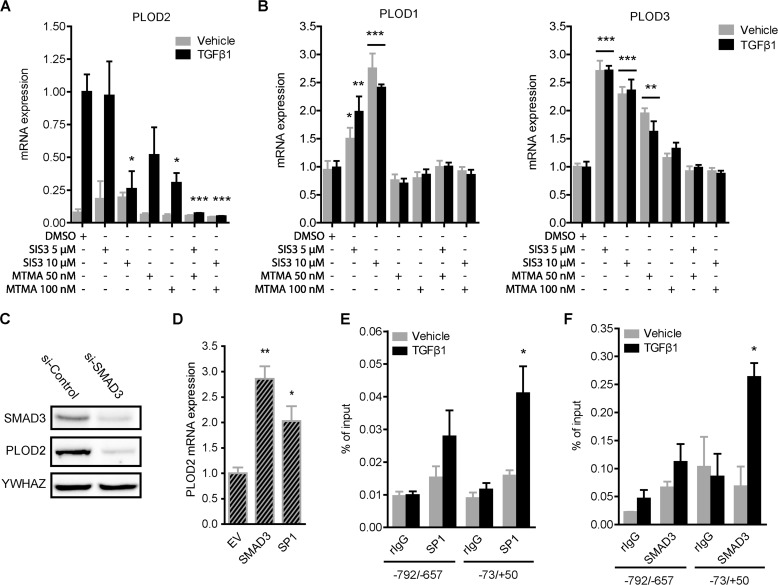
TGFβ1-enhanced PLOD2 expression is regulated via SP1 and Smad3. qRT-PCR analysis of (A) PLOD2 or (B) PLOD1 and PLOD3 mRNA expression from vehicle or TGFβ1-stimulated fibroblasts co-treated with SMAD3 phosphorylation inhibitor (SIS3) or SP1 inhibitor Mitramycin A (MTMA). C, representative Western blot of PLOD2 and SMAD3 from fibroblasts transfected with esiRNA against SMAD3 or control and treated with TGFβ1 for 48 h. D, PLOD2 mRNA expression of fibroblasts transfected with plasmids to overexpress SMAD3, SP1 or empty vector (EV) control. qChIP performed on fibroblasts treated with TGFβ1 or control for 48 h with antibodies against: (E) SP1 and (F) SMAD3. Normal rIgG was used as control, and enrichment for PLOD2 regions −73/+50 and −792/−657 was checked by qPCR and normalized to input. Data are mean ± S.E. (n = 3); *, p < 0.05; **, p < 0.01, unpaired Student's t test. Horizontal bars indicate both sets are significant to their individual control.

