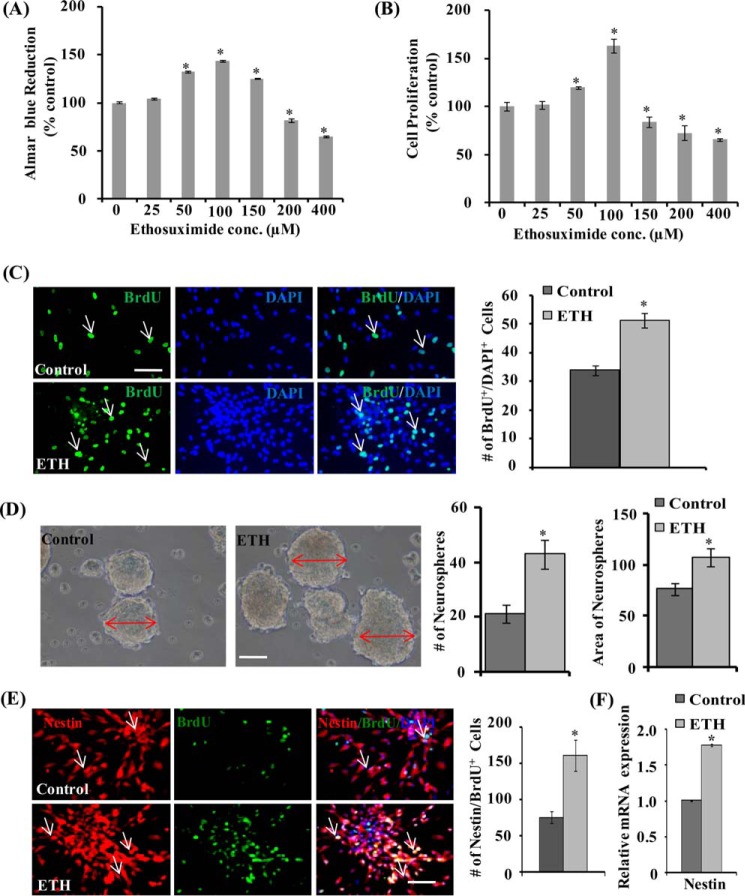
FIGURE 1.
ETH enhances proliferation of the hippocampus-derived NSC and increases the number and size of primary neurospheres. A and B, NSCs derived from the hippocampus were cultured and treated with various concentrations of ETH for 48 h, and cell proliferation was studied. Values are expressed as mean ± S.E. (error bars) (n = 3). *, p < 0.05 versus control. C, BrdU immunocytochemistry in NSC cultures and BrdU-immunopositive cell quantification in the NSC cultures treated with ETH. Shown is a graphical representation of the number of BrdU+ cells labeled with the nuclear stain DAPI. Scale bar, 20 μm. Values are expressed as mean ± S.E. (n = 3). *, p < 0.05 versus control. D, representative phase-contrast photomicrographs of primary neurospheres derived from the hippocampus NSC treated with 100 μm ETH. Shown is a quantification of the number of neurospheres and area of neurospheres. Values are expressed as mean ± S.E. (n = 3). *, p < 0.05 versus control. E, representative immunofluorescence images of hippocampus-derived NSCs co-labeled with BrdU and nestin (neural stem cell marker). Shown is a graphical representation of the number of nestin/BrdU+-co-labeled cells with the nuclear stain DAPI. Values are expressed as mean ± S.E. (n = 3). *, p < 0.05 versus control. Scale bar, 20 μm. F, quantitative real-time PCR analysis was performed for relative mRNA expression of nestin and normalized to β-actin. Values are expressed as mean ± S.E. (n = 3). *, p < 0.05 versus control.

